The Business IQ dashboard provides a general overview of every association's activity metrics. In Vantaca IQ, click the Business menu option to view the Business dashboard.
Each tool on the Business Dashboard includes icons indicating whether it uses live or scheduled data and whether it responds to the date range filter. For more information about these icons, see the "Vantaca IQ: Understanding Live and Scheduled Data" article.
Review the sections in this article for details about the performance tools on the Business dashboard and the information that they track.
Contents
Invoice Overview
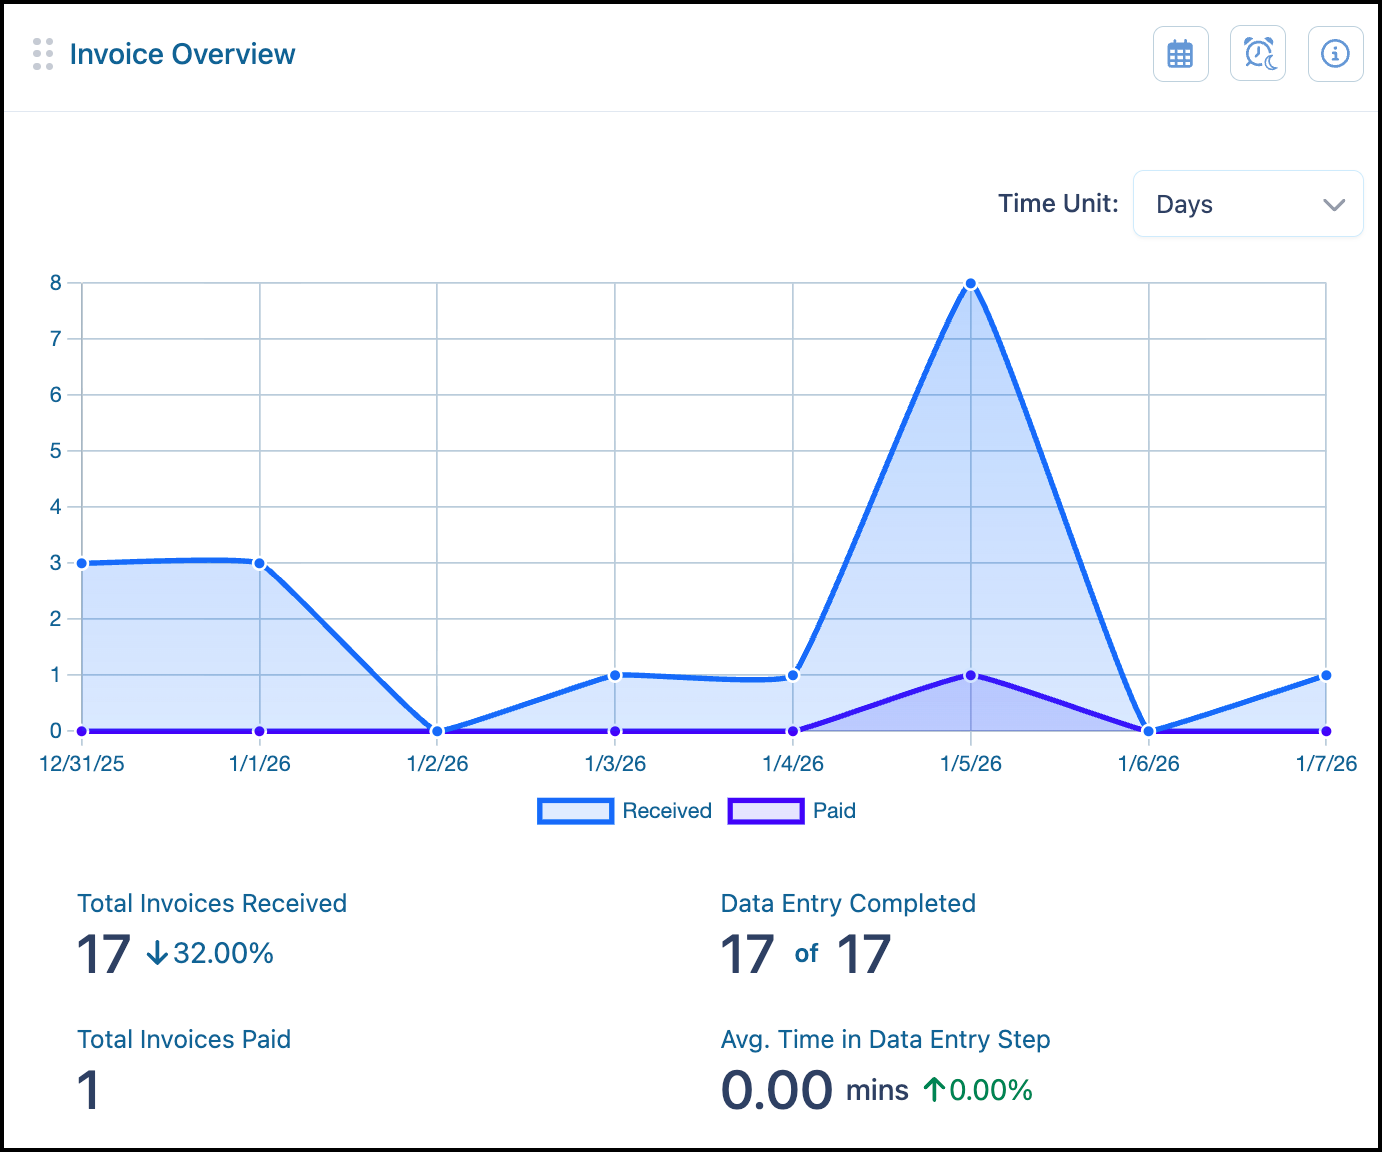
This tool tracks the number of invoices received and paid, the number of invoices processed through the Complete Data Entry step, and the average time those invoices spent in that entry step across all associations (not including voided invoices).
Note: If your associations do not use the Complete Data Entry step, the value displays as 0%. Specific dates may not be shown on the graph if no invoices were paid or received on that date.
Select the desired Time Unit to display plot points as Days, Weeks, or Months.
Action Item Activity
This tool tracks the total number of action items by type and advanced or stepped across all associations (can include sending a message on the item).
Note: The Action Item Activity shows the 10 Activity Types with the highest activity count in the graph at one time.

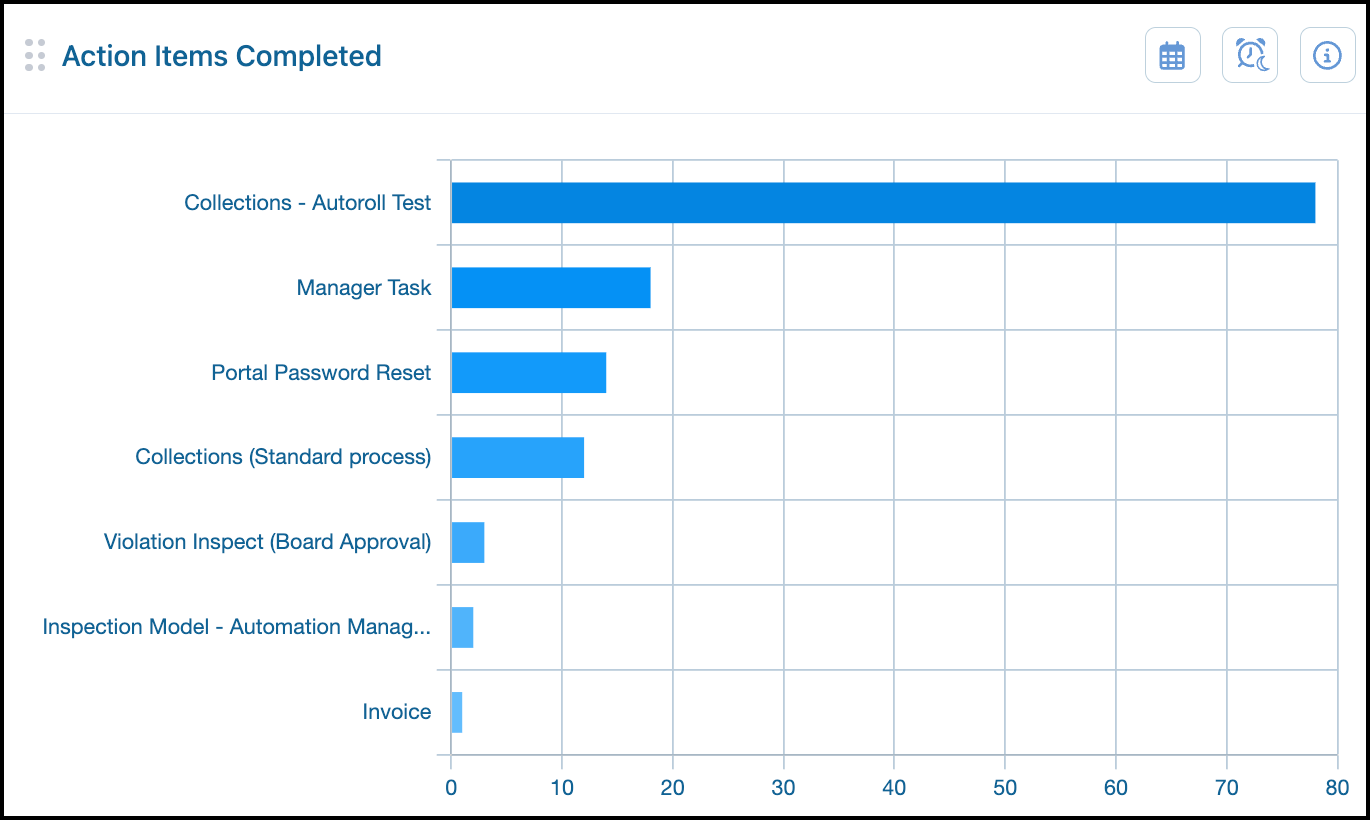
Action Items Completed
This tool tracks the total number of action items, by type, that have been completed across all associations.
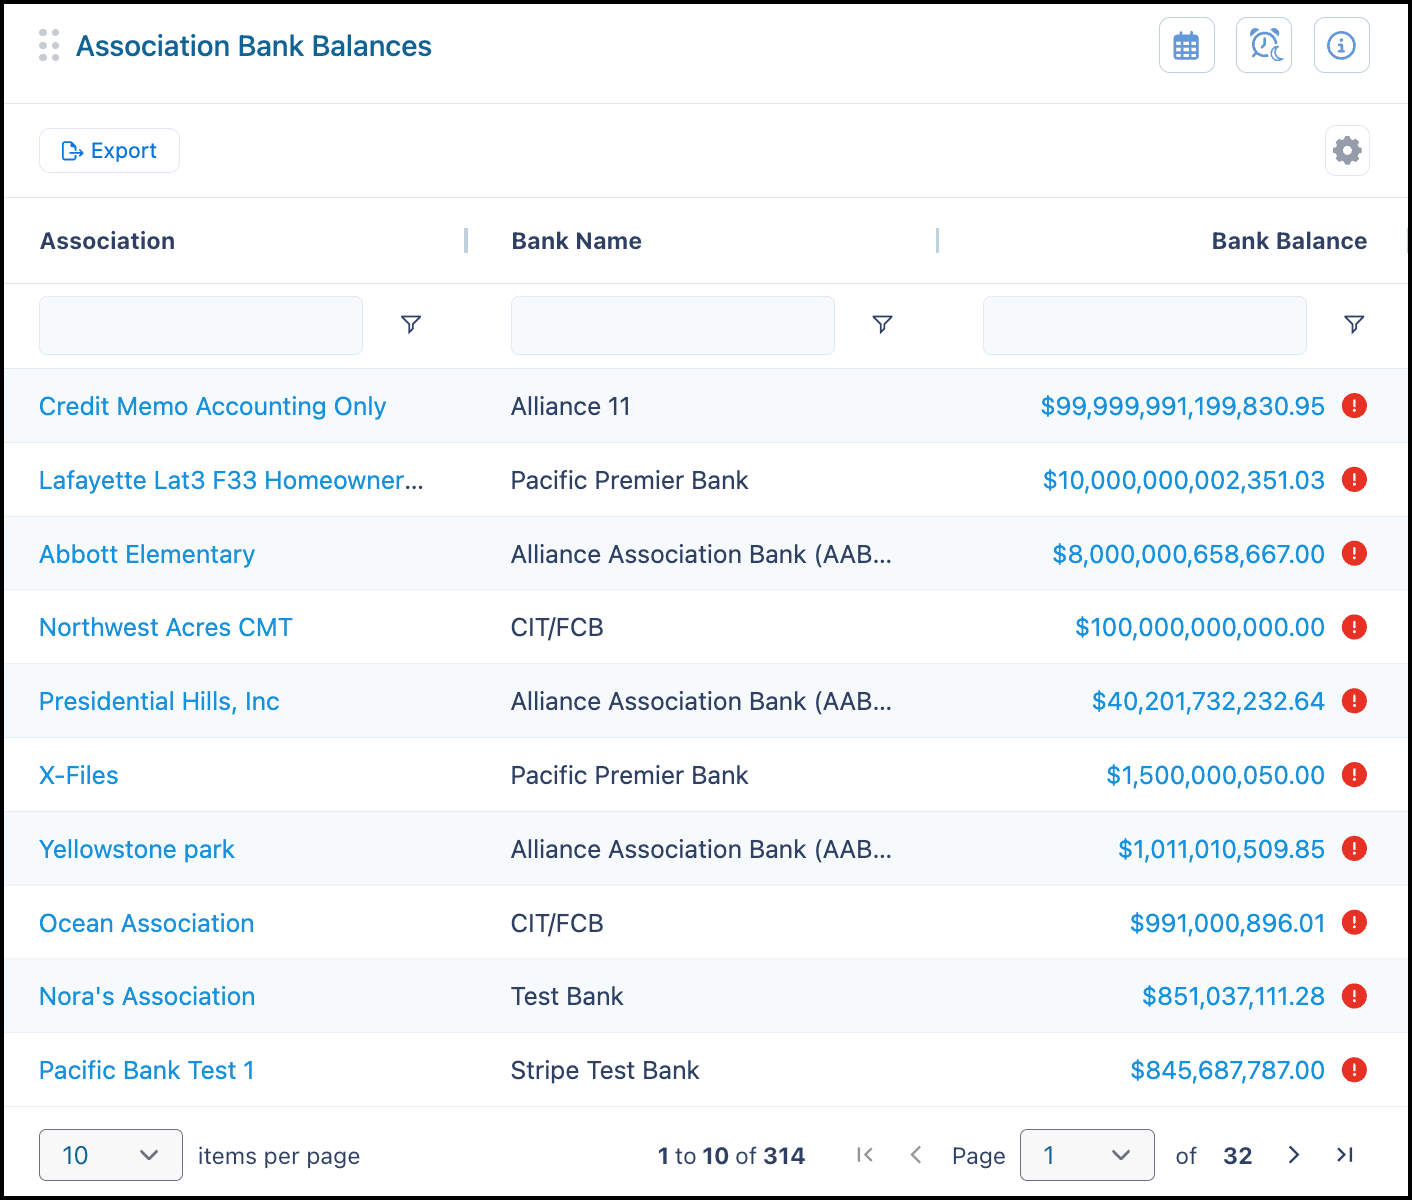
Association Bank Balances
This tool tracks the total balance by bank for each association within your business. The list displays in descending order by Bank Balance to show the bank accounts with the largest balance that could potentially be over the FDIC limit. Balances in excess of $250,000 are indicated with a red exclamation point icon.
Note: Only users with the Vantaca IQ Admin permission under Settings > Roles > Security can view this performance tool.
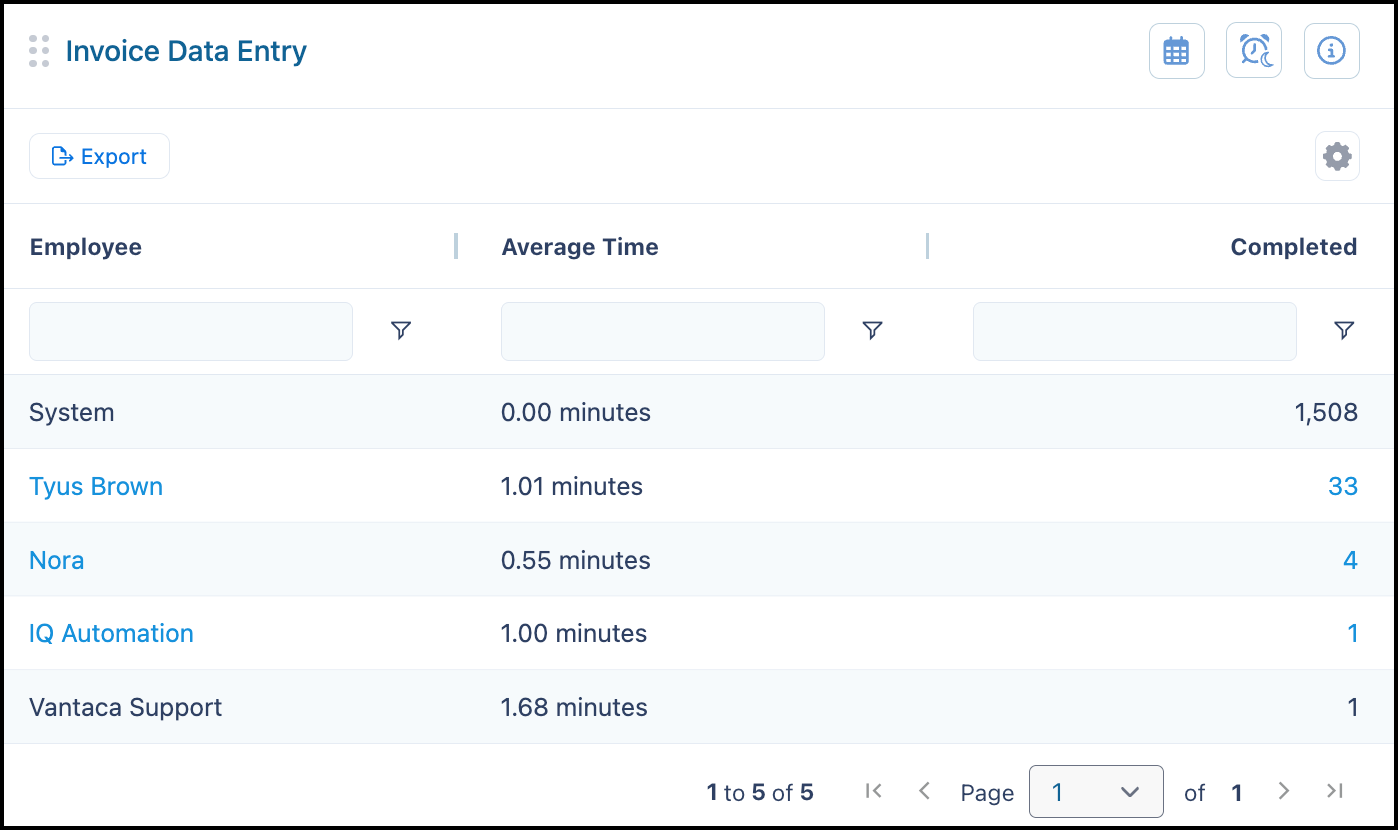
Invoice Data Entry
This tool tracks the number of invoices processed through the Complete Data Entry step and the average time those invoices spent in that entry step (entry time by employee). The employee listed as System indicates the service contracts that are auto-advancing through data entry.
How Coded Invoices Are Calculated
An invoice is considered coded when the data entry screen has been opened and the invoice has been stepped to a configured step beyond the data entry screen step. The data entry screen step is identified by its configured extra action that initiates the data entry process.
-
Average Time (Coding Time): The average time measures how long it takes an employee to complete the data entry process. This is calculated as the time between when the data entry screen was opened and when the action item was stepped to the next step in the workflow.
-
Completed Count: The Completed column shows the number of invoice action items that have been moved to a closing step after being coded by the employee. Click the count to see detailed information about those invoices.
Back to Top
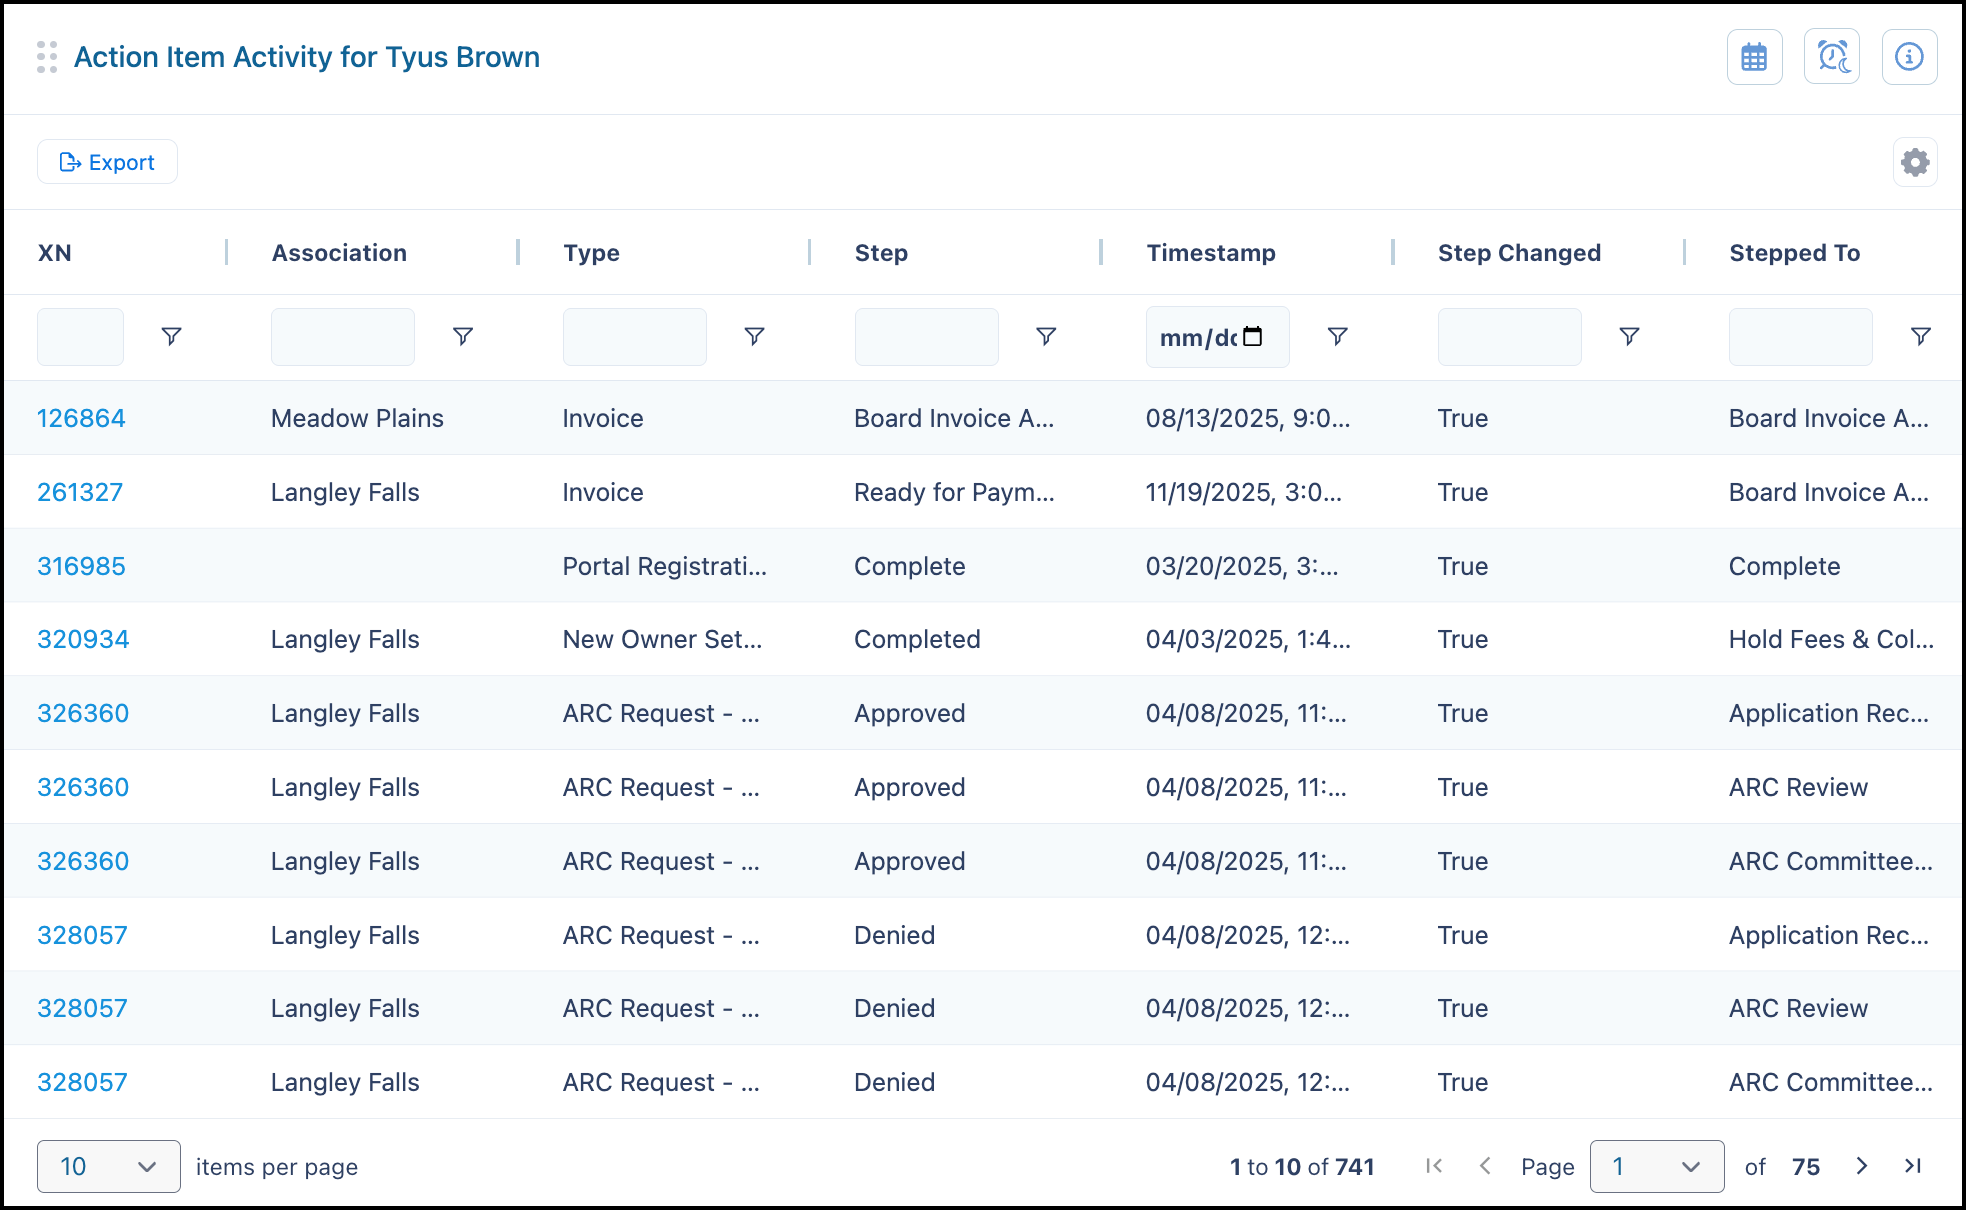
Employee Action Item Activity
This tool displays a list of action items that the employee has taken action on (can include sending a message on the item).
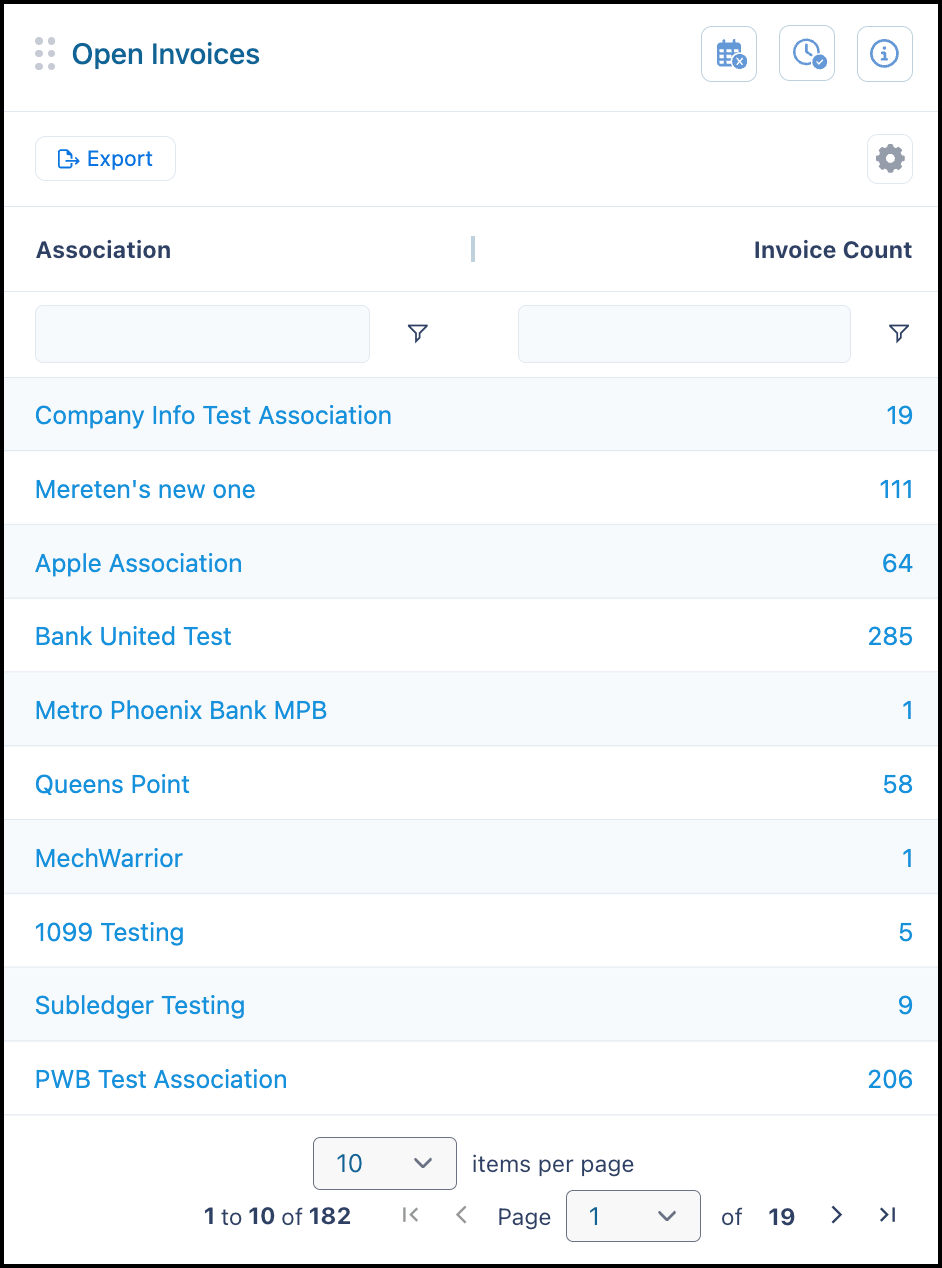
Open Invoices
This tool tracks the total number of open invoices for each association. Click the Invoice Count for an association to see a list of their open invoices.
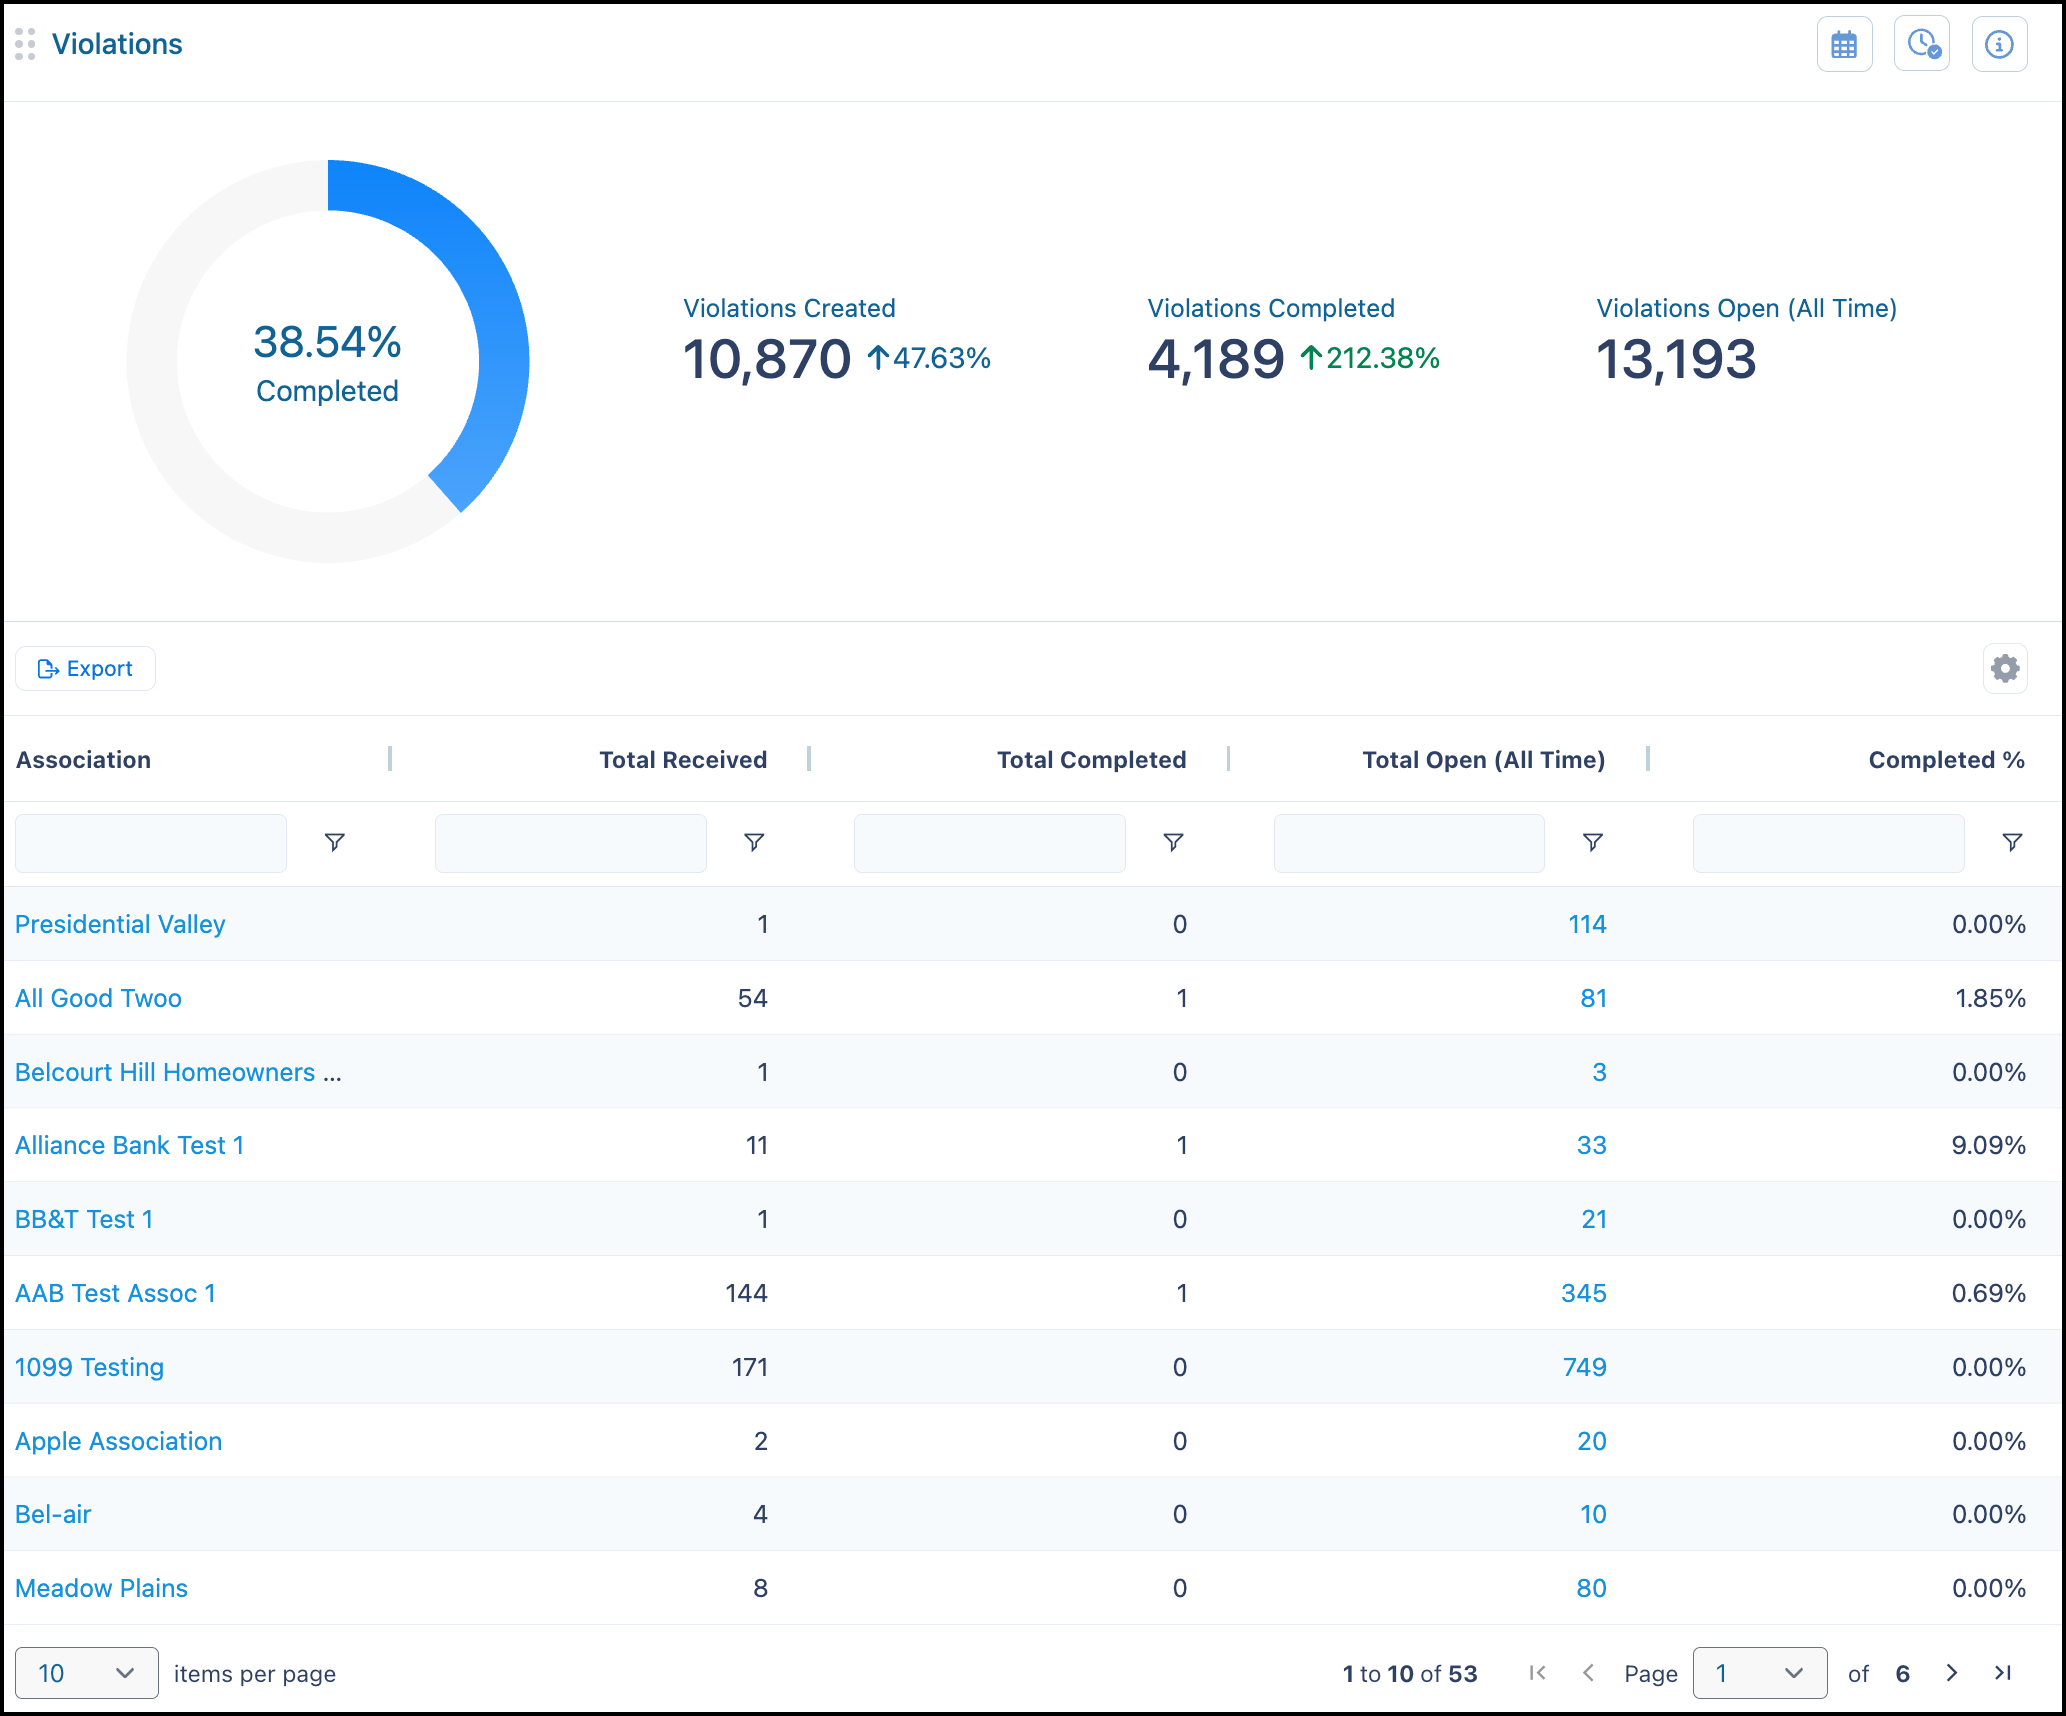
Violations
This tool tracks the number of violations created and completed and the percentage of violation completed in the selected date range across all associations. Open Items are not dependent on date range. Click the count of Total Open for an association to see a list of those open violations
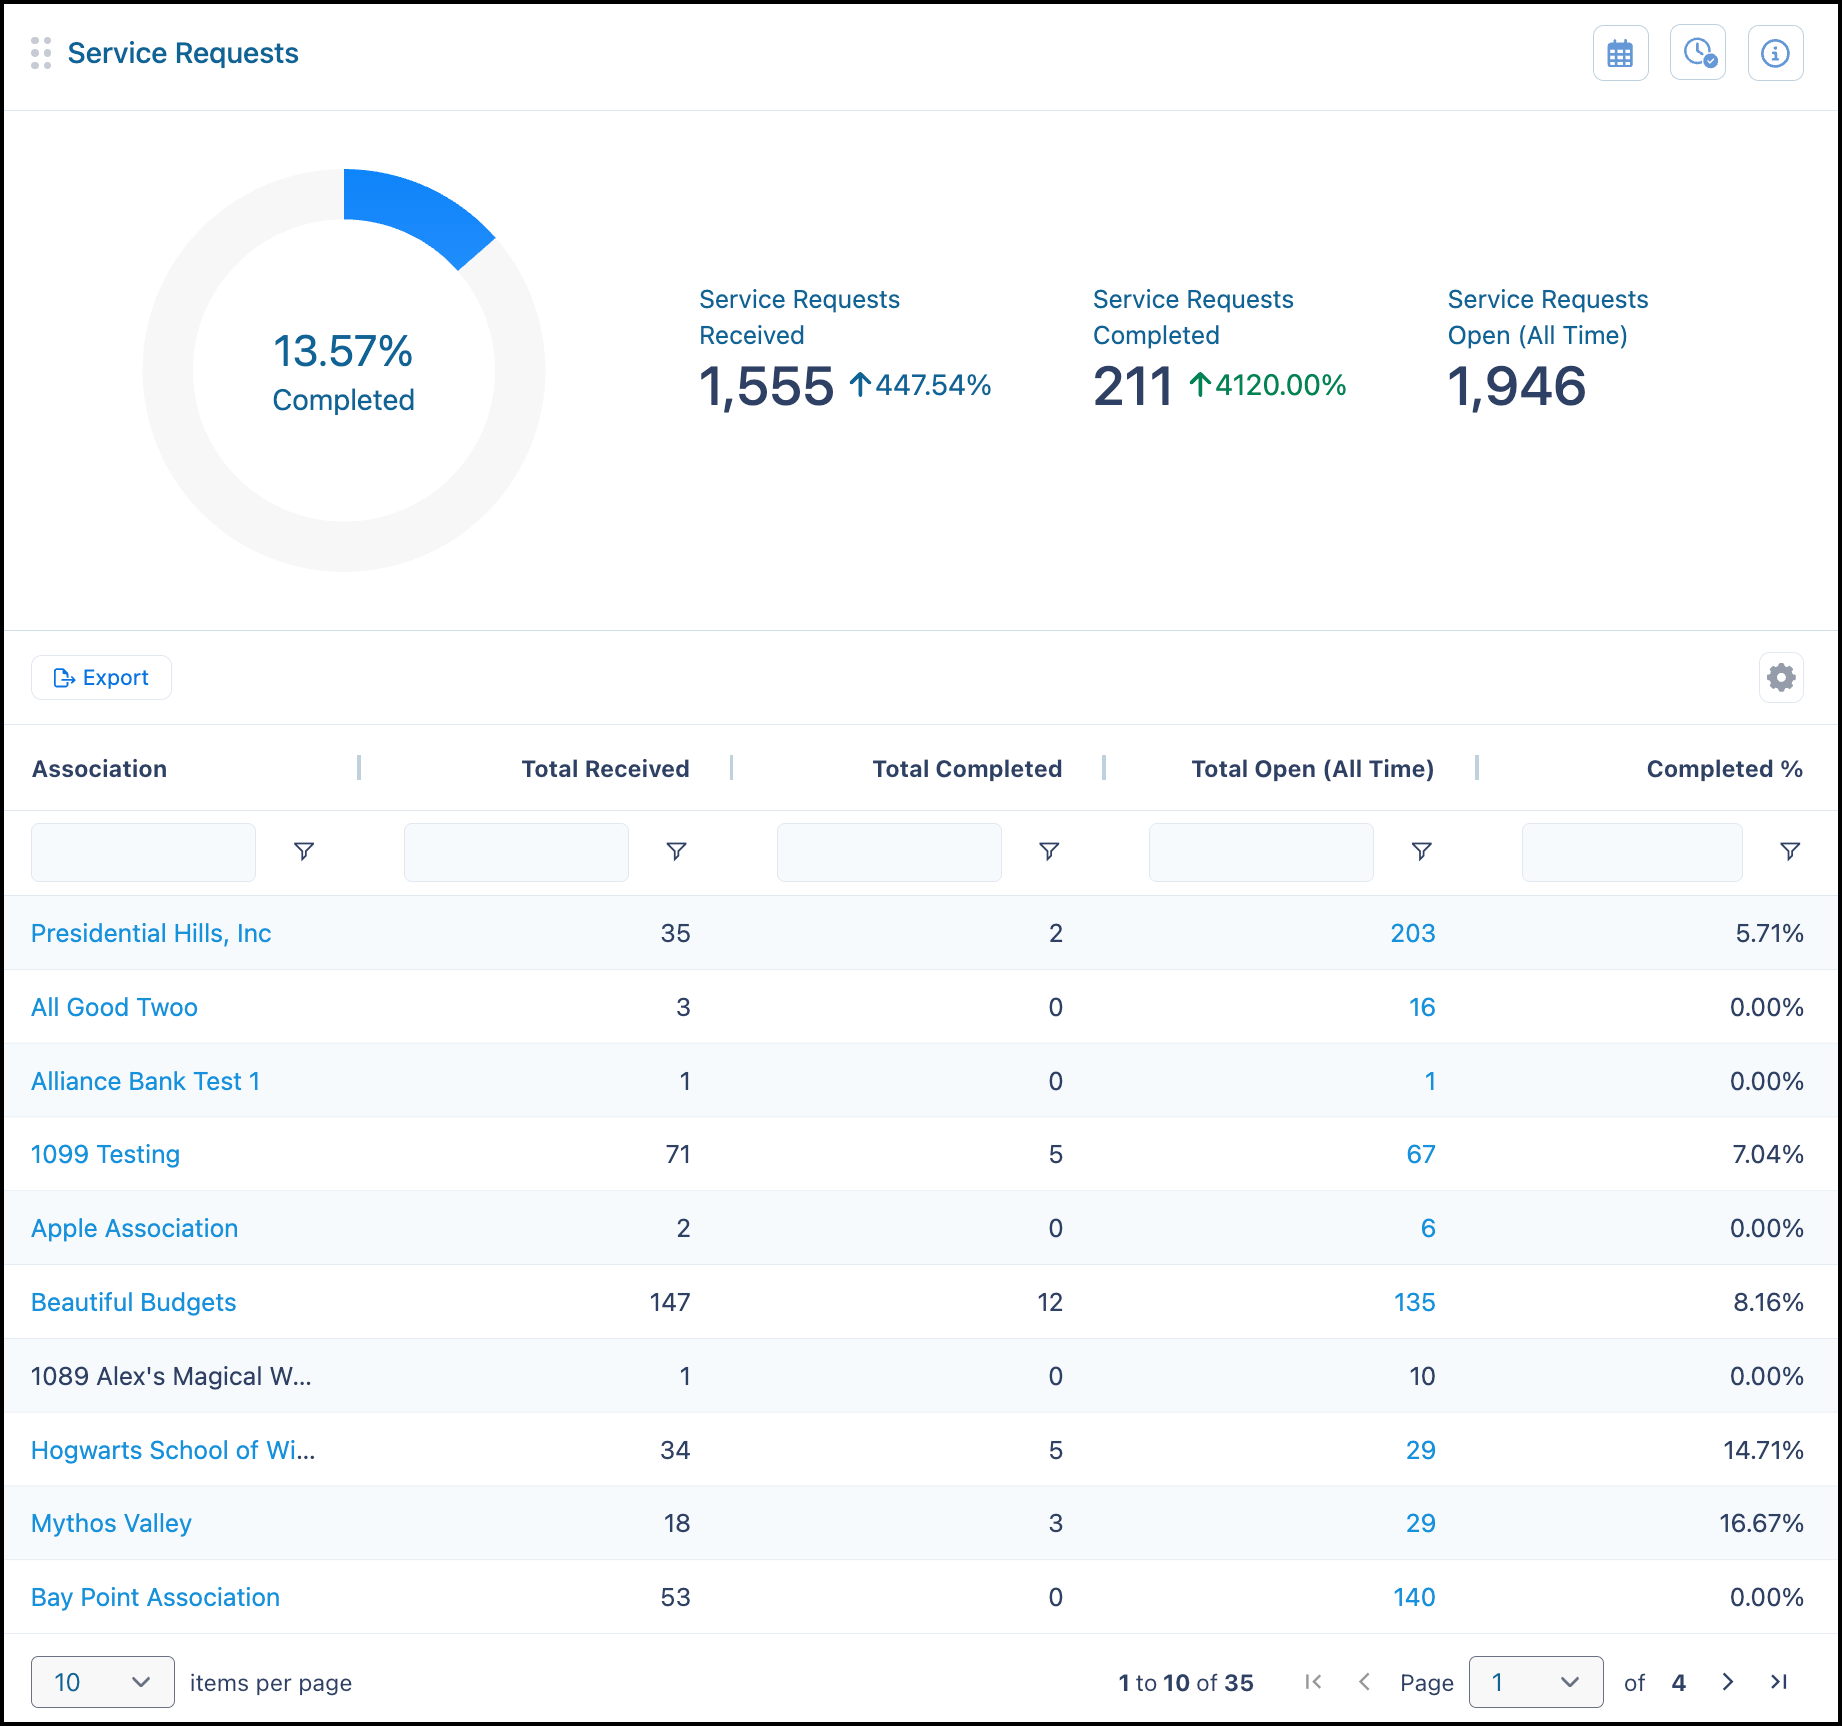
Service Requests
This tool tracks the number of service requests received and completed and the percentage of service request completion across all associations. This includes all Action Types within the Work Order category. Open items do not depend on a date range. Click the value in the Total Open (All Time) column to view a list of open requests for that association.
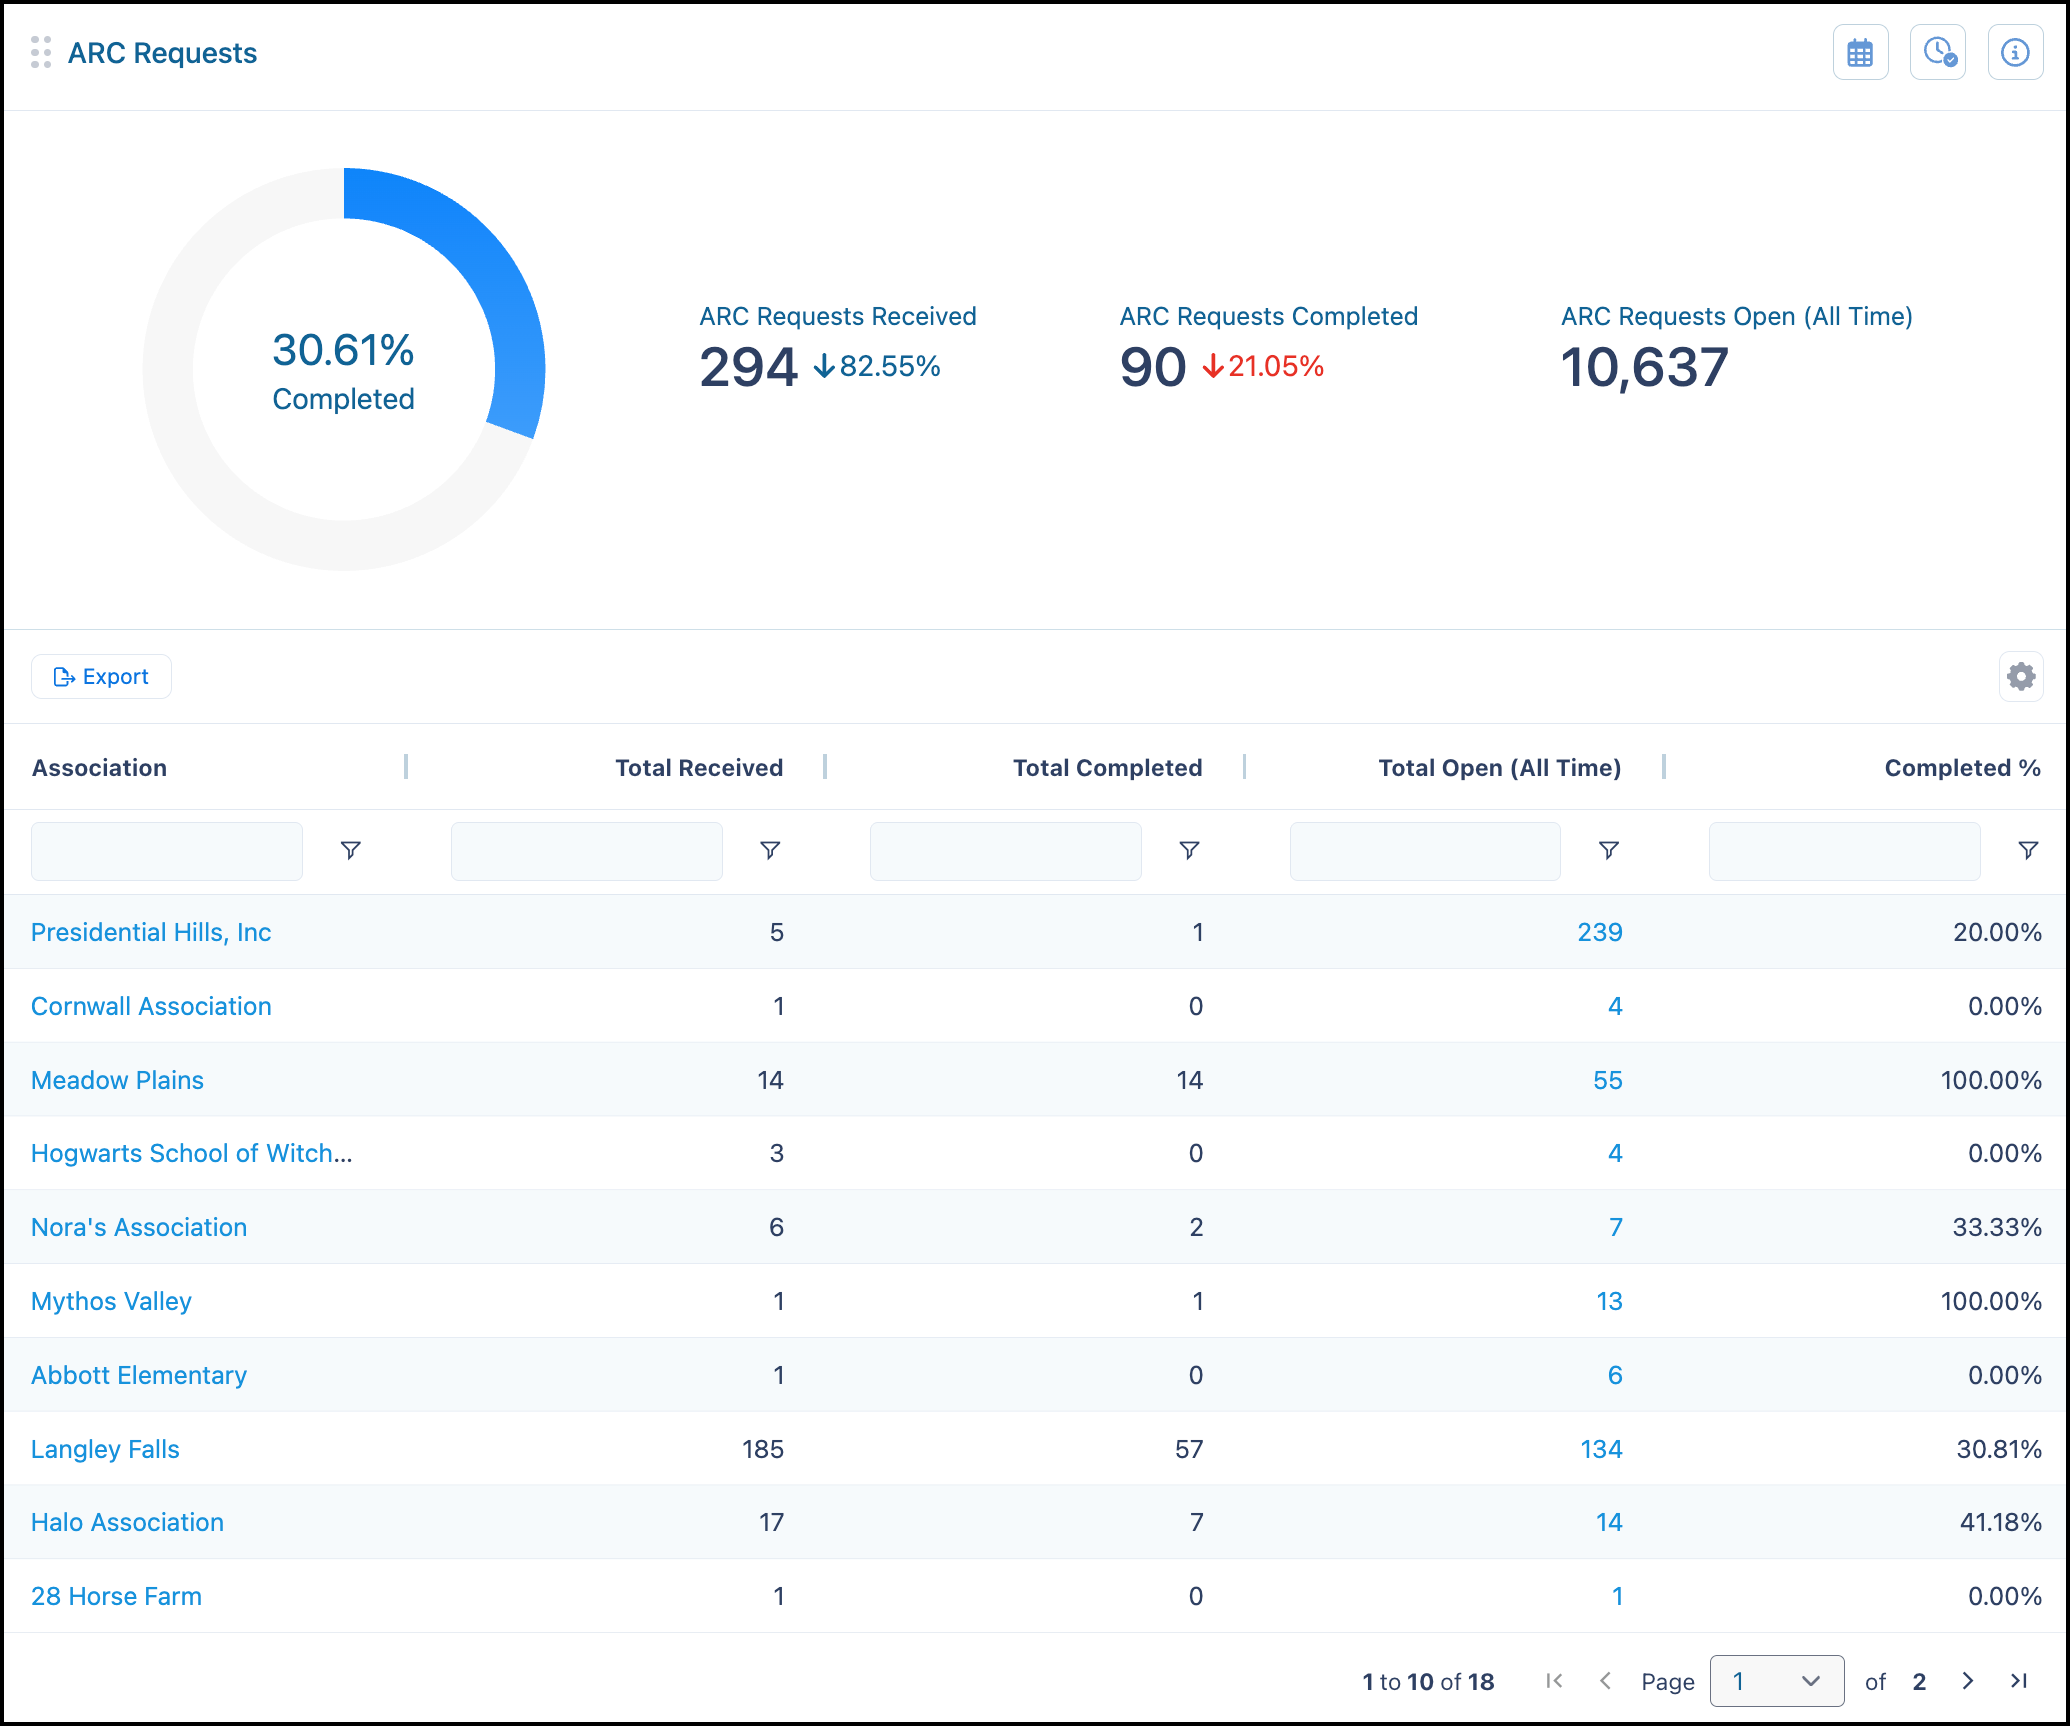
ARC Requests
This tool tracks the number of ARC requests received and completed and the percentage of ARC request completion across all associations. Open items do not depend on a date range. Click the value of Total Open requests for an association to see a list of those open requests.
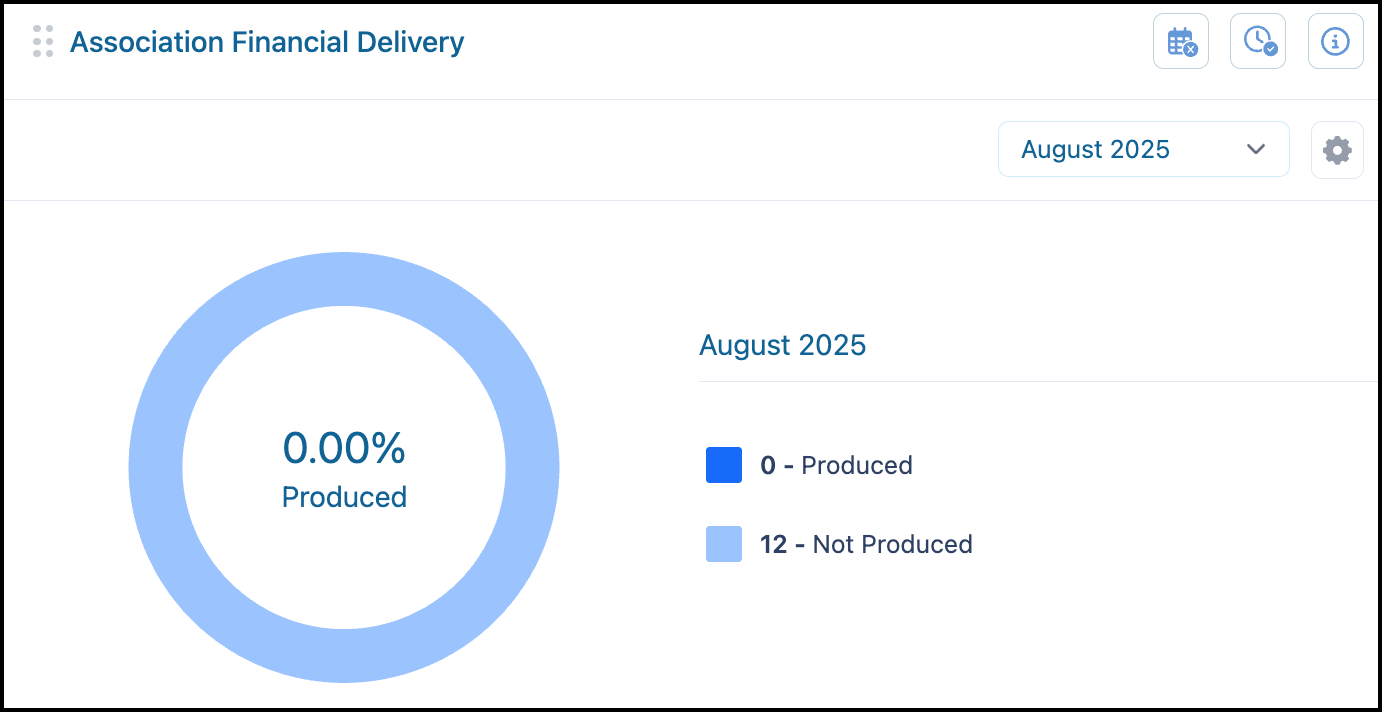
Association Financial Delivery
This tool shows the number of associations that have produced their financials for the selected month based on the criteria set by the user. Use the Tool Settings to configure this tool as needed. Click each section to see more detail..
Note: The Financial Delivery tool defaults to displaying the prior month when first opened. For example, if you open the tool on January 15, it will display December data by default. The Days Open calculation is based on the Opening Step and Closing Step configured in the tool settings, not the action item creation and close dates. This provides more accurate timing for the financial reporting process.
Important: You must add all of the action types that you use for financial delivery to ensure that the tool functions properly.
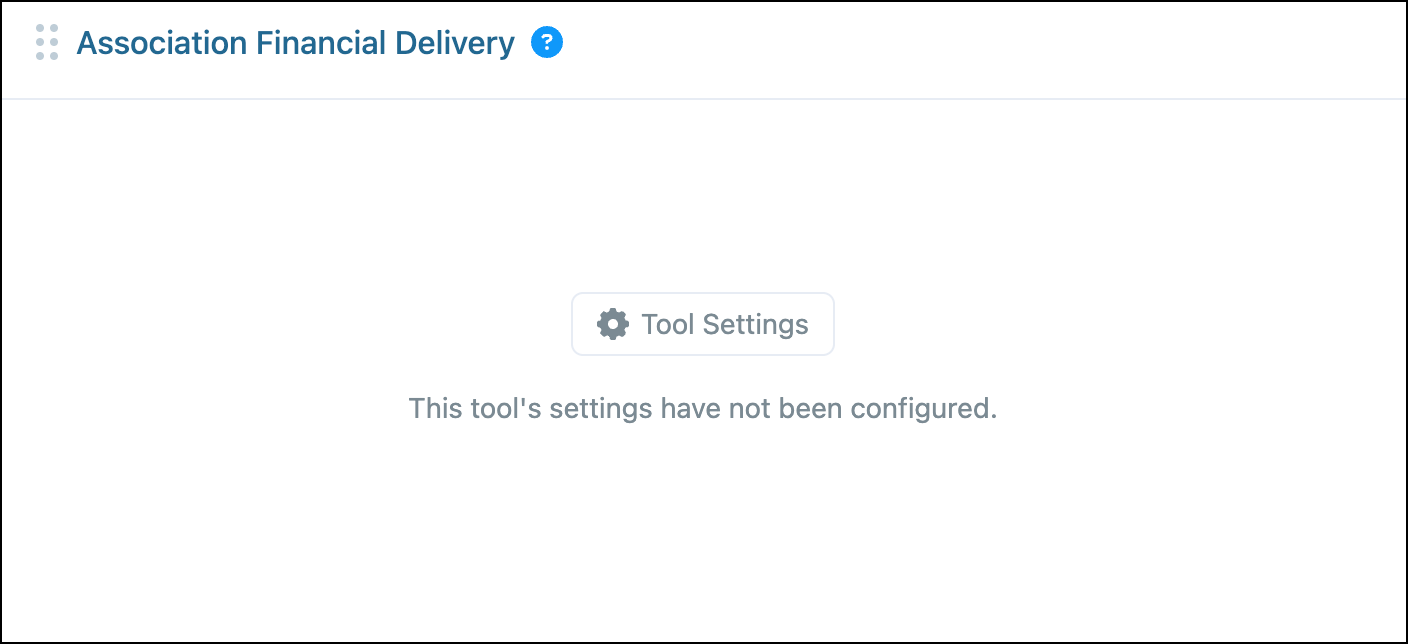
Configure this tool prior to use:
-
Click Tool Settings.
-
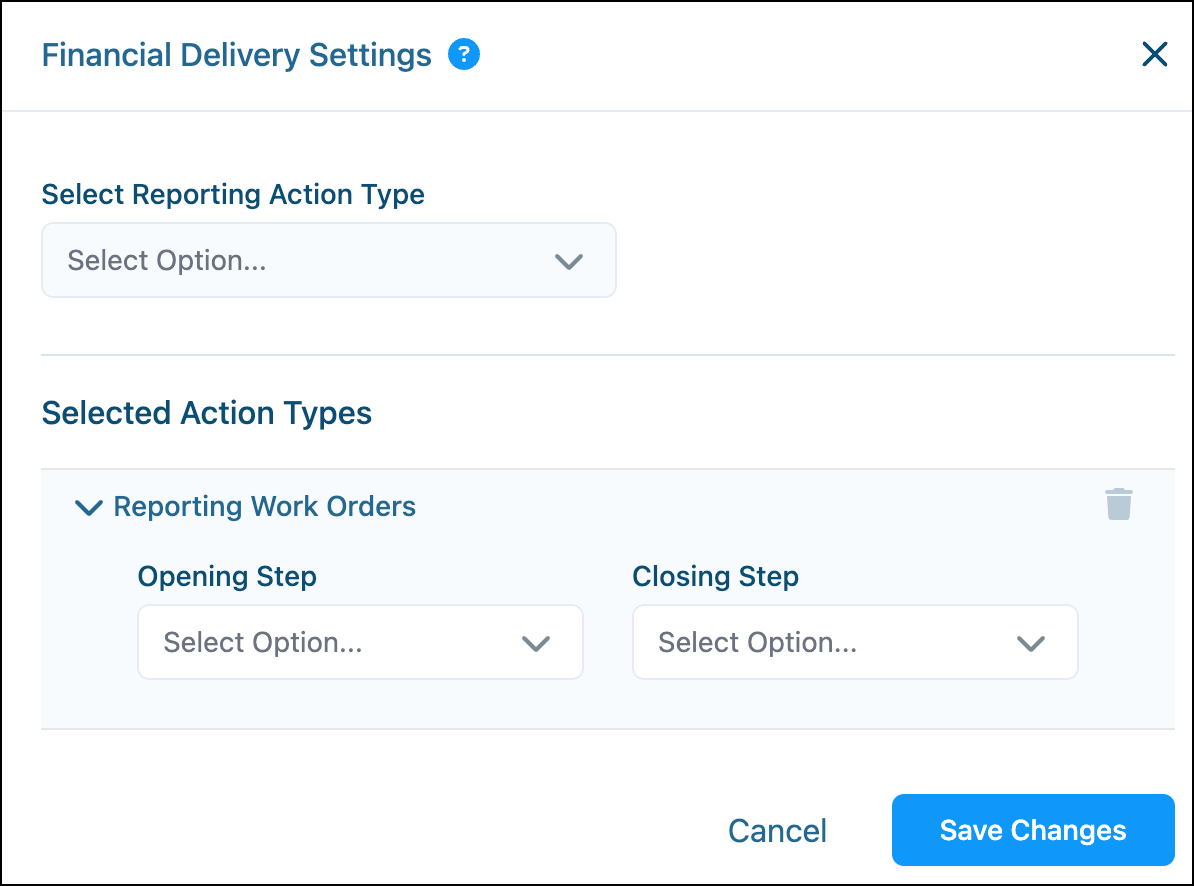
Select the Reporting Action Type in the Financial Delivery Settings screen. The available action types for the opening and closing steps displays.
-
Select the Opening Step and the Closing Step that you wish to track, and then click Save Changes.
Homeowner and Board Login Activity
Use this tool to access comprehensive insights into homeowner and board member login activity. View unique logins and the frequency of homeowner logins, shown by association. Easily identify homeowners and properties without login information or email addresses and take action when needed.
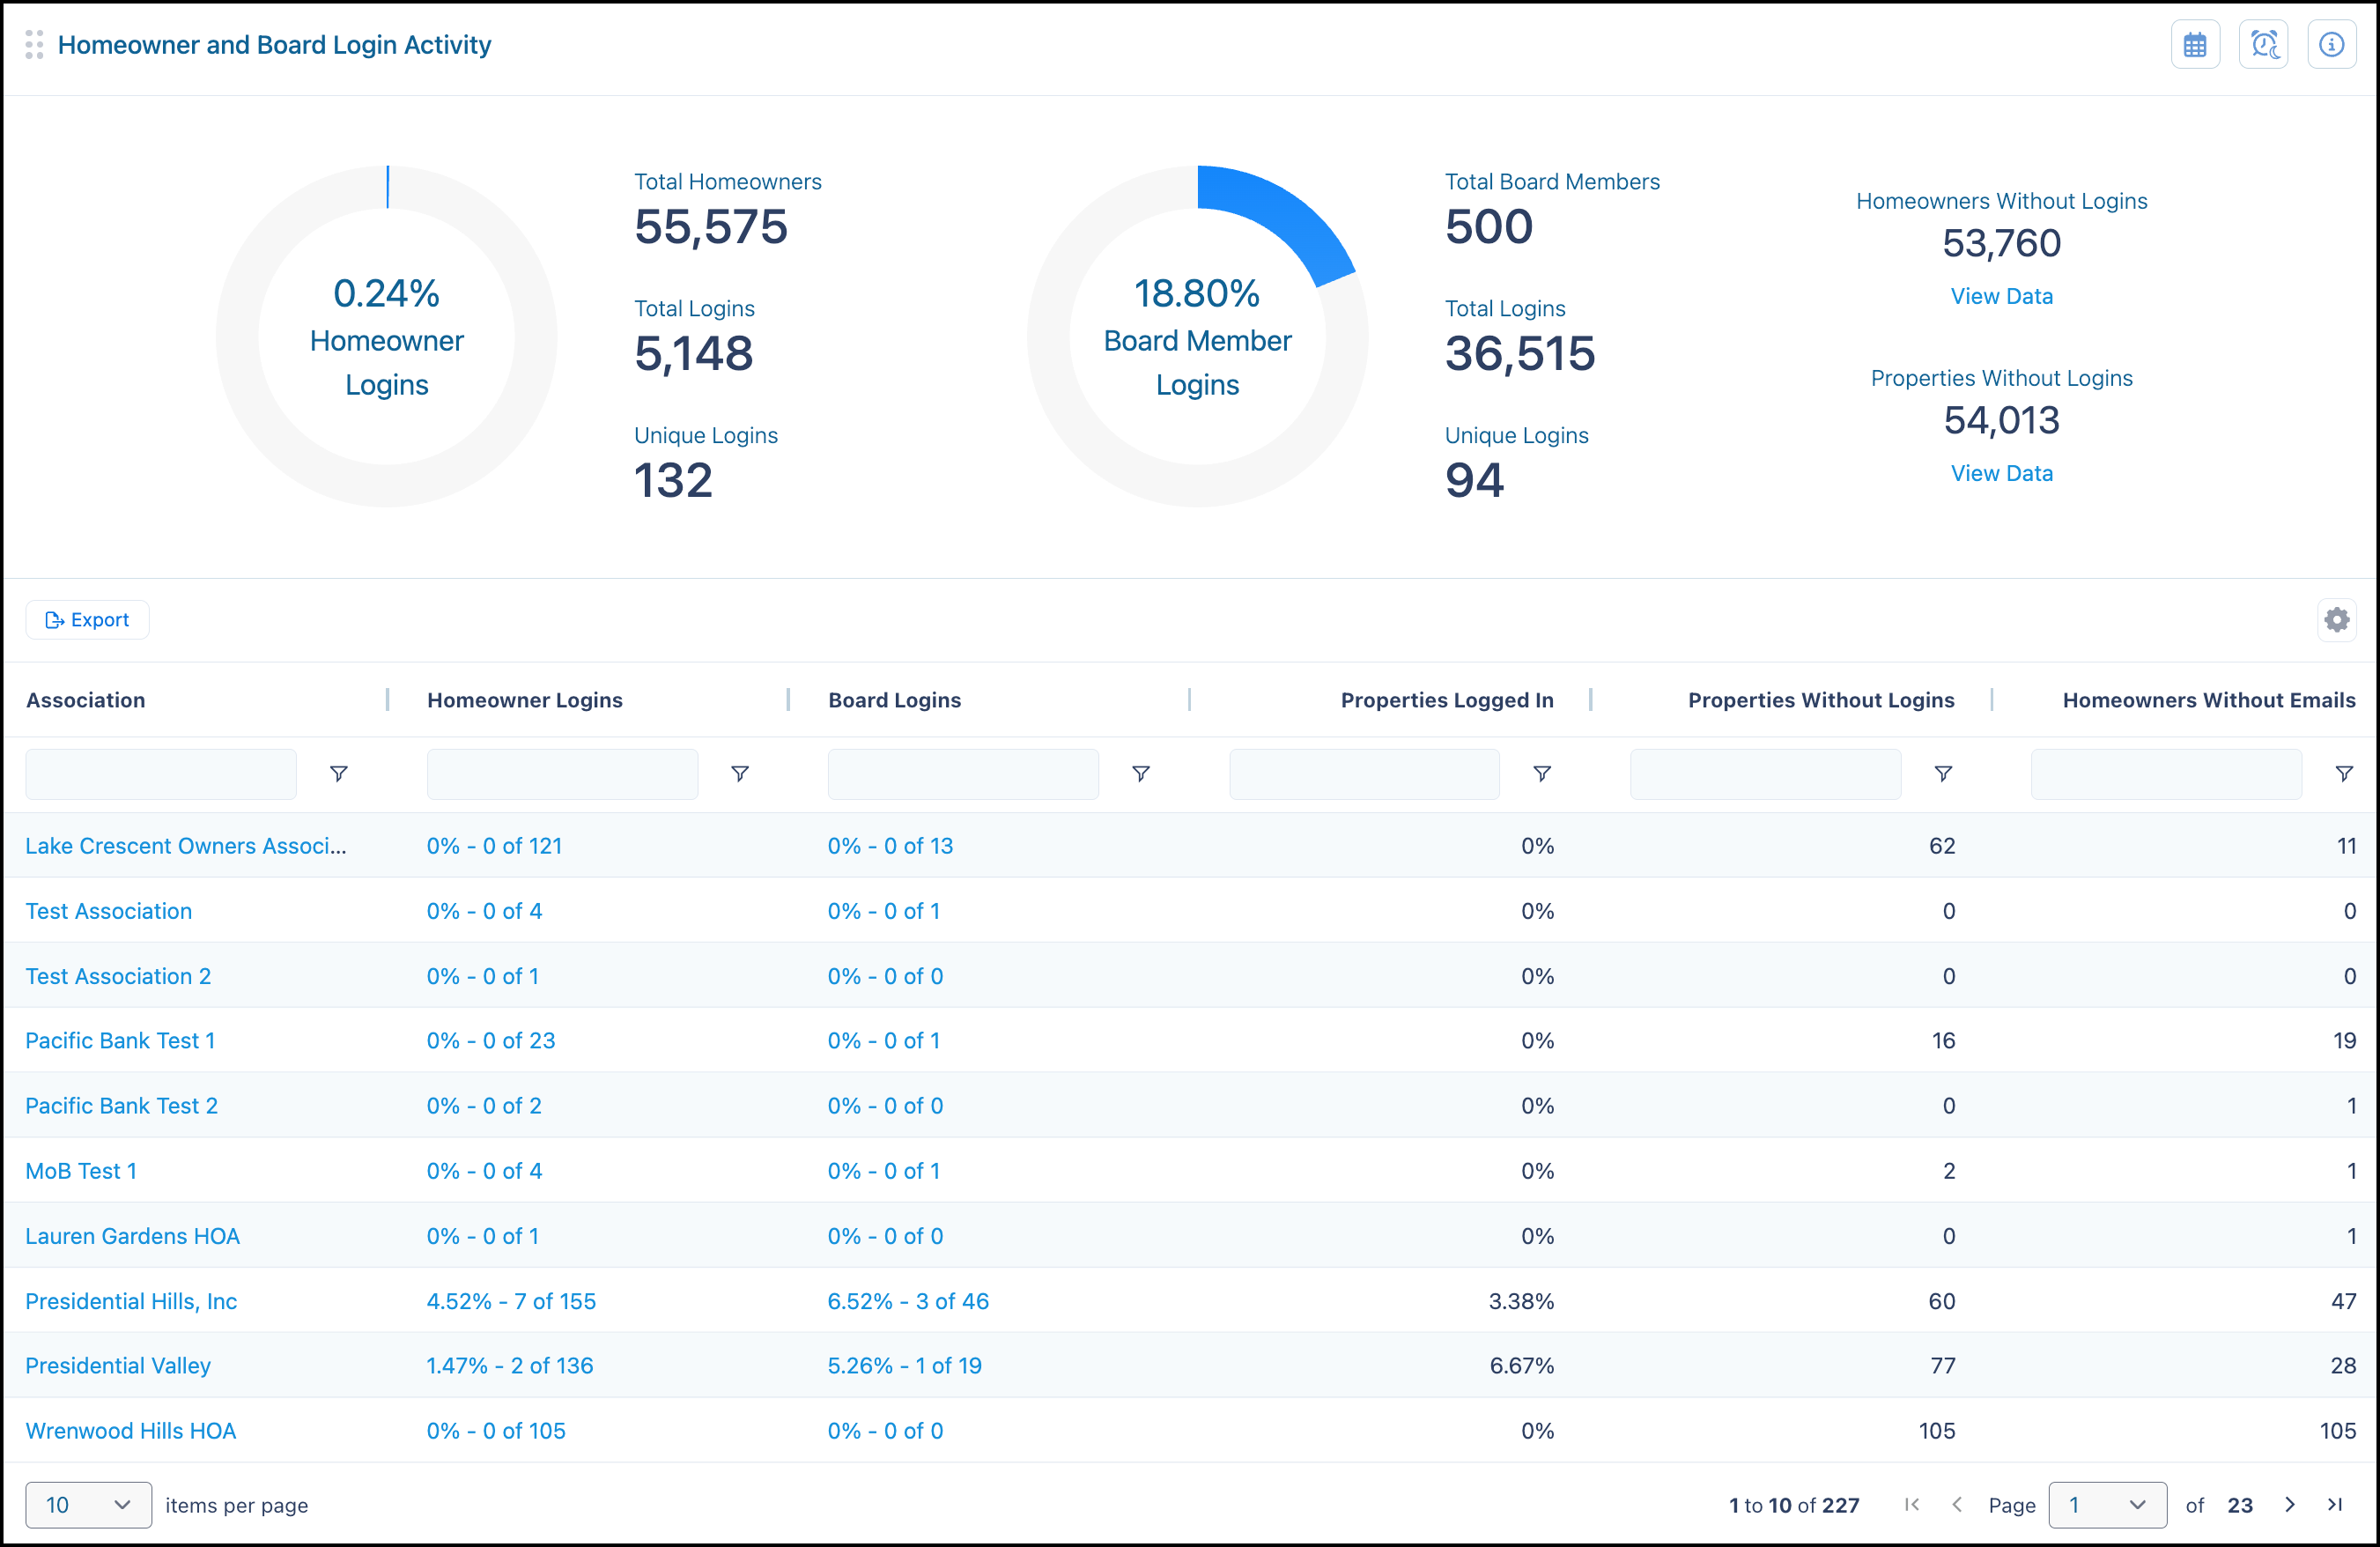
Tip: Use the hamburger menu in the column header (shows on hover) to add a column for Portfolio.
In the table, click the login percentage in the Homeowner Logins or Board Logins column for each association to explore login activity in detail.
Back to Top
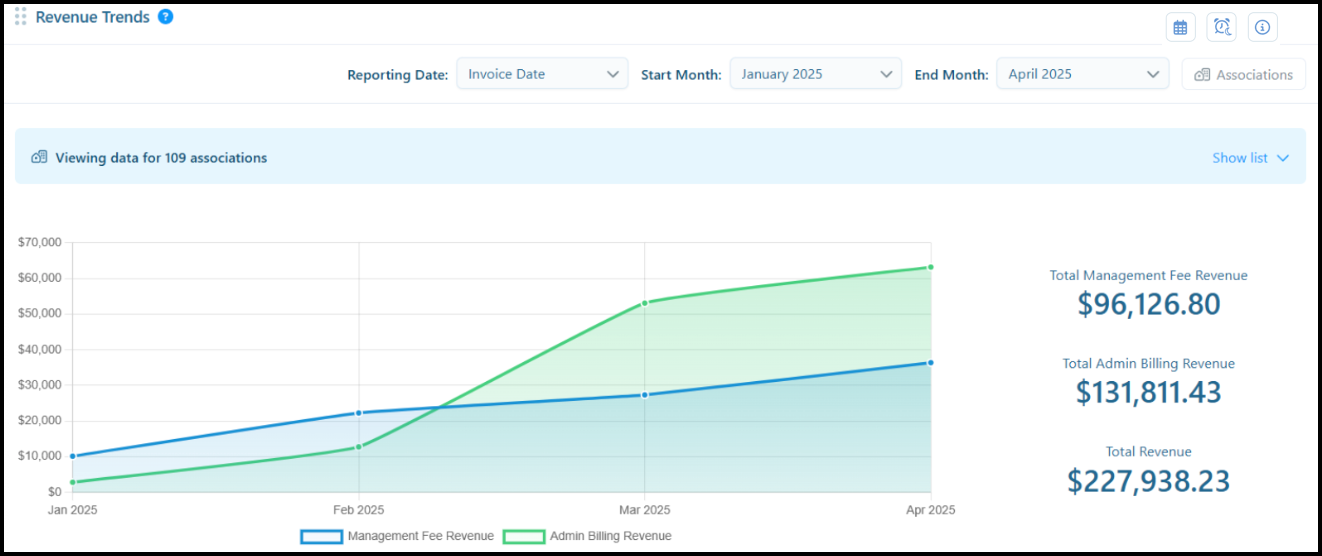
Revenue Trends
Use this tool to track fee revenue over time while monitoring critical revenue streams, identifying trends, and making data-driven decisions regarding fee structures and financial performance. This tool shows monthly management and administrative fee revenue patterns, so you can better understand your revenue composition, identify seasonal variations, and track the growth or decline in specific revenue categories.
If you share this dashboard the filtering persists, so those you share it with see the same date range, associations, etc. Shared users cannot make changes (view only).
Important: Users require specific permissions to view this tool or it displays with a lock icon and they will see a message to contact their system manager. For more information about the permissions, see the "Vantaca IQ - Securities and Permissions" article.
Tool details:
-
Reporting Date options:
-
Invoice Date: The total association monthly revenue as of the invoice date.
-
Ledger Date: The total association monthly revenue as of the invoice date.
-
Start Month and End Month: Defaults to a 13 month historical view when you have that much data; otherwise, starts from January 2025 and you can adjust the timeframe to any time within the last two years (when data is available).
-
Associations: Click to filter by selecting individual associations or view all associations (default).
-
Data returned:
-
Month-based: Data is a sum of Management fee and admin billing revenue as of the end of the month.
-
Sum/Total: Data is a total of the management fee and admin fee revenue (sum of the fee revenue for each entry in the array) displayed separately, and the total revenue of both together.

Comments
0 comments
Please sign in to leave a comment.