Use this guide to find the information that you need about navigation, filtering, drag and drop, printing, etc.
Contents
Navigation
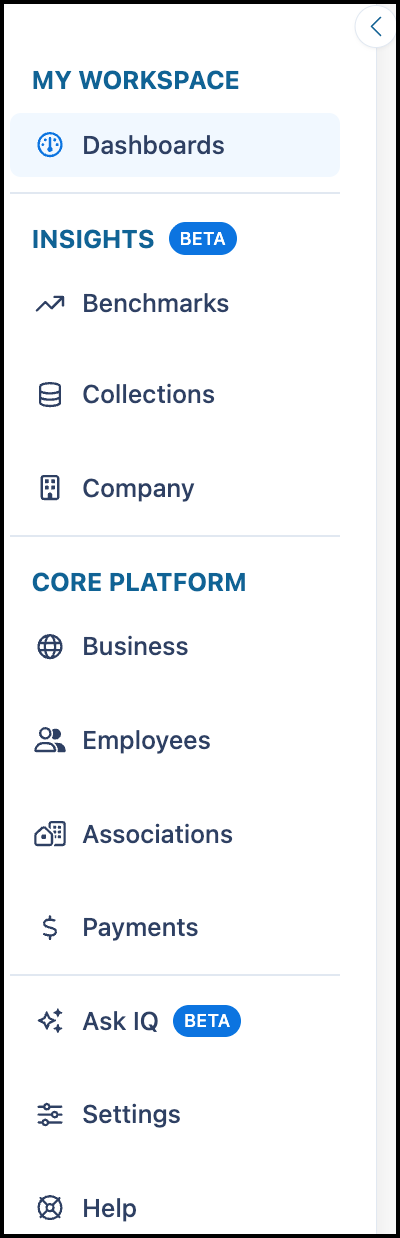
The left-hand navigation in Vantaca IQ organizes features into three main categories:
- My Workspace (containing Dashboards)
- Insights (containing Benchmarks, Collections, and Company
- Core Platform (containing Business, Employees, Associations, and Payments).
This provides an intuitive navigation experience that groups related functionality together. The Ask IQ (Beta) feature is also moved into the main navigation as a direct link for easier access.
Note: When you minimize the navigation, the icons remain to identify the options.
Use the menu options to access the following information:
-
My Workspace: Your personal workspace where you can access your dashboards.
-
Dashboards: The default landing page. View, create, and manage individual and multiple (team) dashboards. For more information, see the "Vantaca IQ - Dashboards" article.
-
Insights: Provides comprehensive business intelligence and analytics for your management company. For more information, see the "Vantaca IQ - Insights" article
-
Benchmarks: Compare your company's performance against industry peers across different company sizes.
-
Collections: Analyze collection delinquency rates and effectiveness.
-
Company: Displays company-wide metrics across portfolio growth, revenue performance, and employee productivity.
-
Core Platform:
-
Business: Provides a general overview of association activity metrics. For more information, see the "Vantaca IQ - Business Dashboard" article.
-
Employees: Shows the employees that use Vantaca in your organization, the portfolios and roles assigned to them, and the number of associations and properties that they manage. For more information, see the "Vantaca IQ - Employees Dashboard" article.
-
Associations: Shows a list of all associations within your organization, association type, portfolios assigned to each, and each association property count. For more information, see the "Vantaca IQ - Associations Dashboard" article.
-
Payments: Provides analyses of association payment metrics. For more information, see the "Vantaca IQ - Payments Dashboard" article.
-
Ask IQ: An intelligent assistant built into Vantaca IQ, that is designed to help you find answers quickly, streamline workflows, and easily access key features. For more information, see the "Use AskIQ to Enhance Your Vantaca IQ Experience" article.
-
Settings: Vantaca IQ Admins will see a Settings navigation option that does not display for those without admin permissions. For more information, see the Vantaca IQ Settings Page section in the "Vantaca IQ - Securities and Permissions" article
-
Help: Click to open the Help page where you can navigate to the Vantaca IQ articles within the Vantaca Support Library.
Dashboards
-
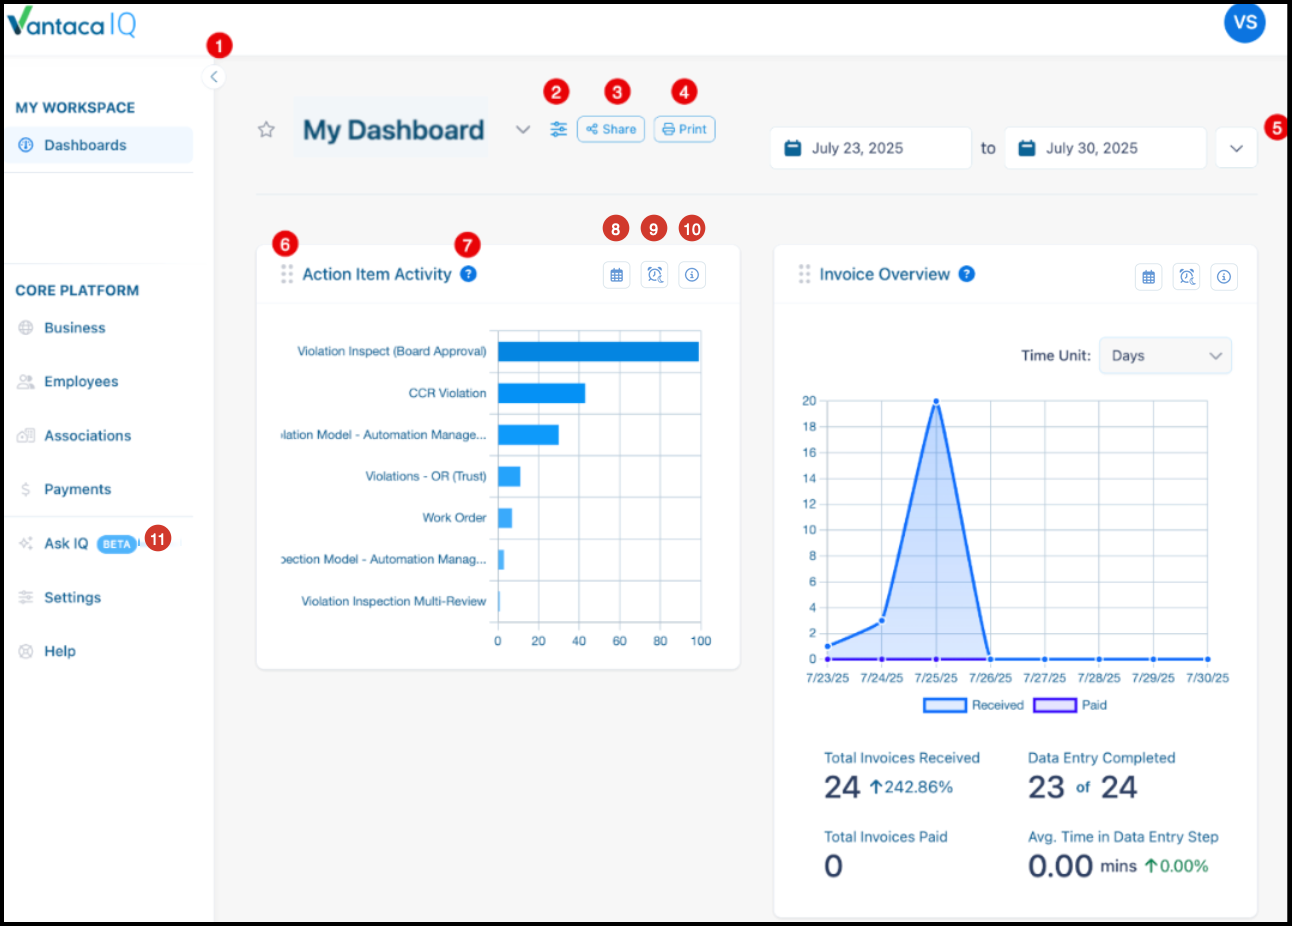
Navigation Menu: Click the Navigation caret (1) to collapse or expand the Navigation Menu from the full view to icons as needed to provide more screen space.
-
Dashboard Controls: Click the Filters icon (2) to open the Dashboard Controls screen where, depending on the dashboard, you can enable, disable, add, or delete Performance tools on your dashboard, and delete your dashboard (where available).
-
Share: Click Share (3) to share your dashboard with other members of your organization. This button is only available for IQ Admins. For more information, see the "Vantaca IQ - Dashboards" article.
-
Print: Click Print (4) in the dashboard header to print the dashboard. A single print file is created for you to preview.
-
Date Range: Select the Date Range (5) for the information that you want to view. The default is Last 7 Days where available. For Custom Dates, click and select your dates from the calendar pop-up.
Note: Your Custom Date Range cannot exceed 24 months.
-
Rearrange: Move each performance tool on the Business dashboard by clicking and dragging the Double Vertical Ellipsis icon (6) to the desired location.
-
Information: Click the Question Mark (7) icon on each performance tool to open a tooltip with a brief description of the information displayed in that tool.
-
Date Range (8): Icons indicating whether the tool (or specific Benchmarks page) data responds to the date range filter set in the dashboard header. For more information, see the "Vantaca IQ: Understanding Live and Scheduled Data" article.
-
Data Source (9): Icons indicating whether the tool (or specific Benchmarks page) displays live data (updated in real-time) or scheduled refresh data (updated on a regular cadence). Hover over this icon to see tooltips with additional details, including the last update time for scheduled data. For more information, see the "Vantaca IQ: Understanding Live and Scheduled Data" article.
- Information (10): Hover to view information about the information displayed in the tool.
-
AskIQ: Vantaca IQ Admins can click AskIQ (11) to open the Vantaca IQ intelligent assistant to find answers and access key features quickly. For more information, see the "Use AskIQ to Enhance Your Vantaca IQ Experience" article.
Columns
You can sort, move, and resize columns:
-
Column Header: Click a column header to sort in ascending or descending order.
-
Reconfigure: Move columns by dragging and dropping each column sideways to the desired location.
-
Resize: Change the column size by hovering over the vertical bar icon at the end of each column, and when you see the double arrows, expand or decrease the size.
Each column header includes a hamburger menu that appears when you hover over the column. Click the Hamburger menu to access the following tabs:
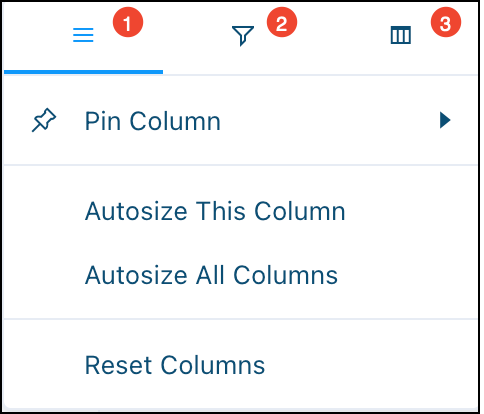
This tab includes the following options:
-
Pin Column: Hover over the caret and select one of the options:
Note: This function, combined with the ability to drag and drop columns, allows you to create customized tables based on your individual needs.
-
Pin Left: Pins column as the leftmost column.
-
Pin Right: Pins column as the rightmost column.
-
No Pin: Does not pin the column.
-
Autosize This Column: Click to automatically size this specific column.
-
Autosize All Columns: Click to automatically size all of the columns in the table.
-
Reset Columns: Click to resize all of the columns back to the original.
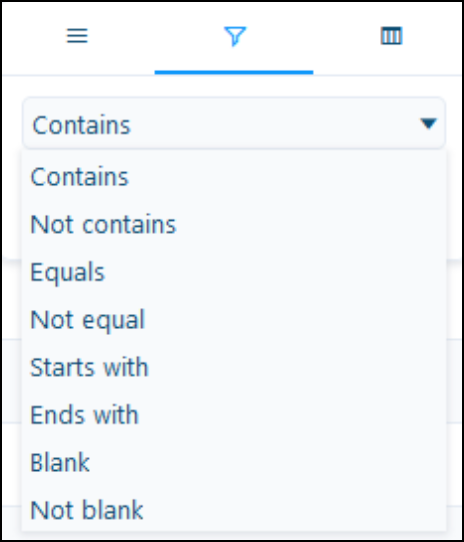
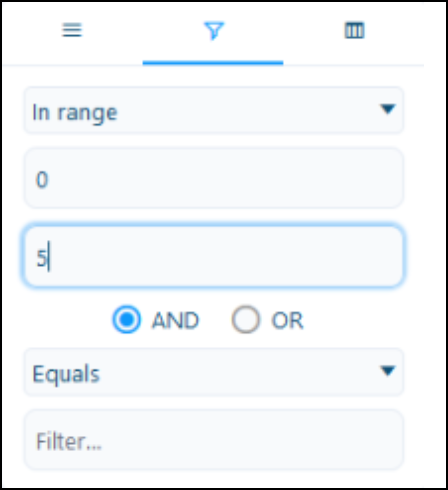
Filter Tab
This tab includes the following filter options:
Note: You can also access the filter options by clicking the Filter ( ) icon beside the Search field:
-
For alphanumeric values, such as Employee Names and Association Names, you can filter specific values to show them in the tool.
-
For numeric values, such as Activity Counts or Average Times, you can select from a variety of dropdown options to refine results as needed. For example, You could set a range between 0 and 5 for the Completed column in the Invoice Data Entry tool to see all the employees who completed 1-4 Invoice Action Items (this range finds values greater than 0 but less than 5).
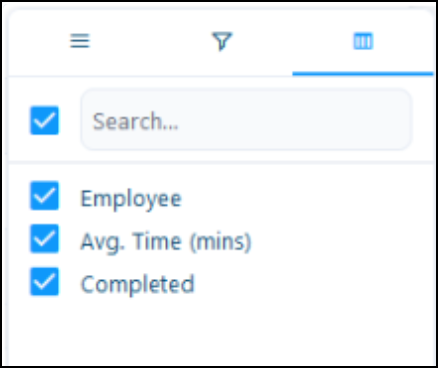
Columns Tab
This tab allows you to select each column that you want to show in the table.
Copy and Export
Right-click any value within a tool to view the following options:
-
Copy: Copies the selected value to the clipboard.
-
Copy with Headers: Copies the selected value and headers to the clipboard.
-
Copy with Group Headers: Copies the selected value with headers and header groups to the clipboard.
-
Export: Select one of the following options:
-
CSV Export: Exports the information to a CSV (.csv) file.
-
Excel Export: Exports the information to a Microsoft Excel (.xlsx) file.
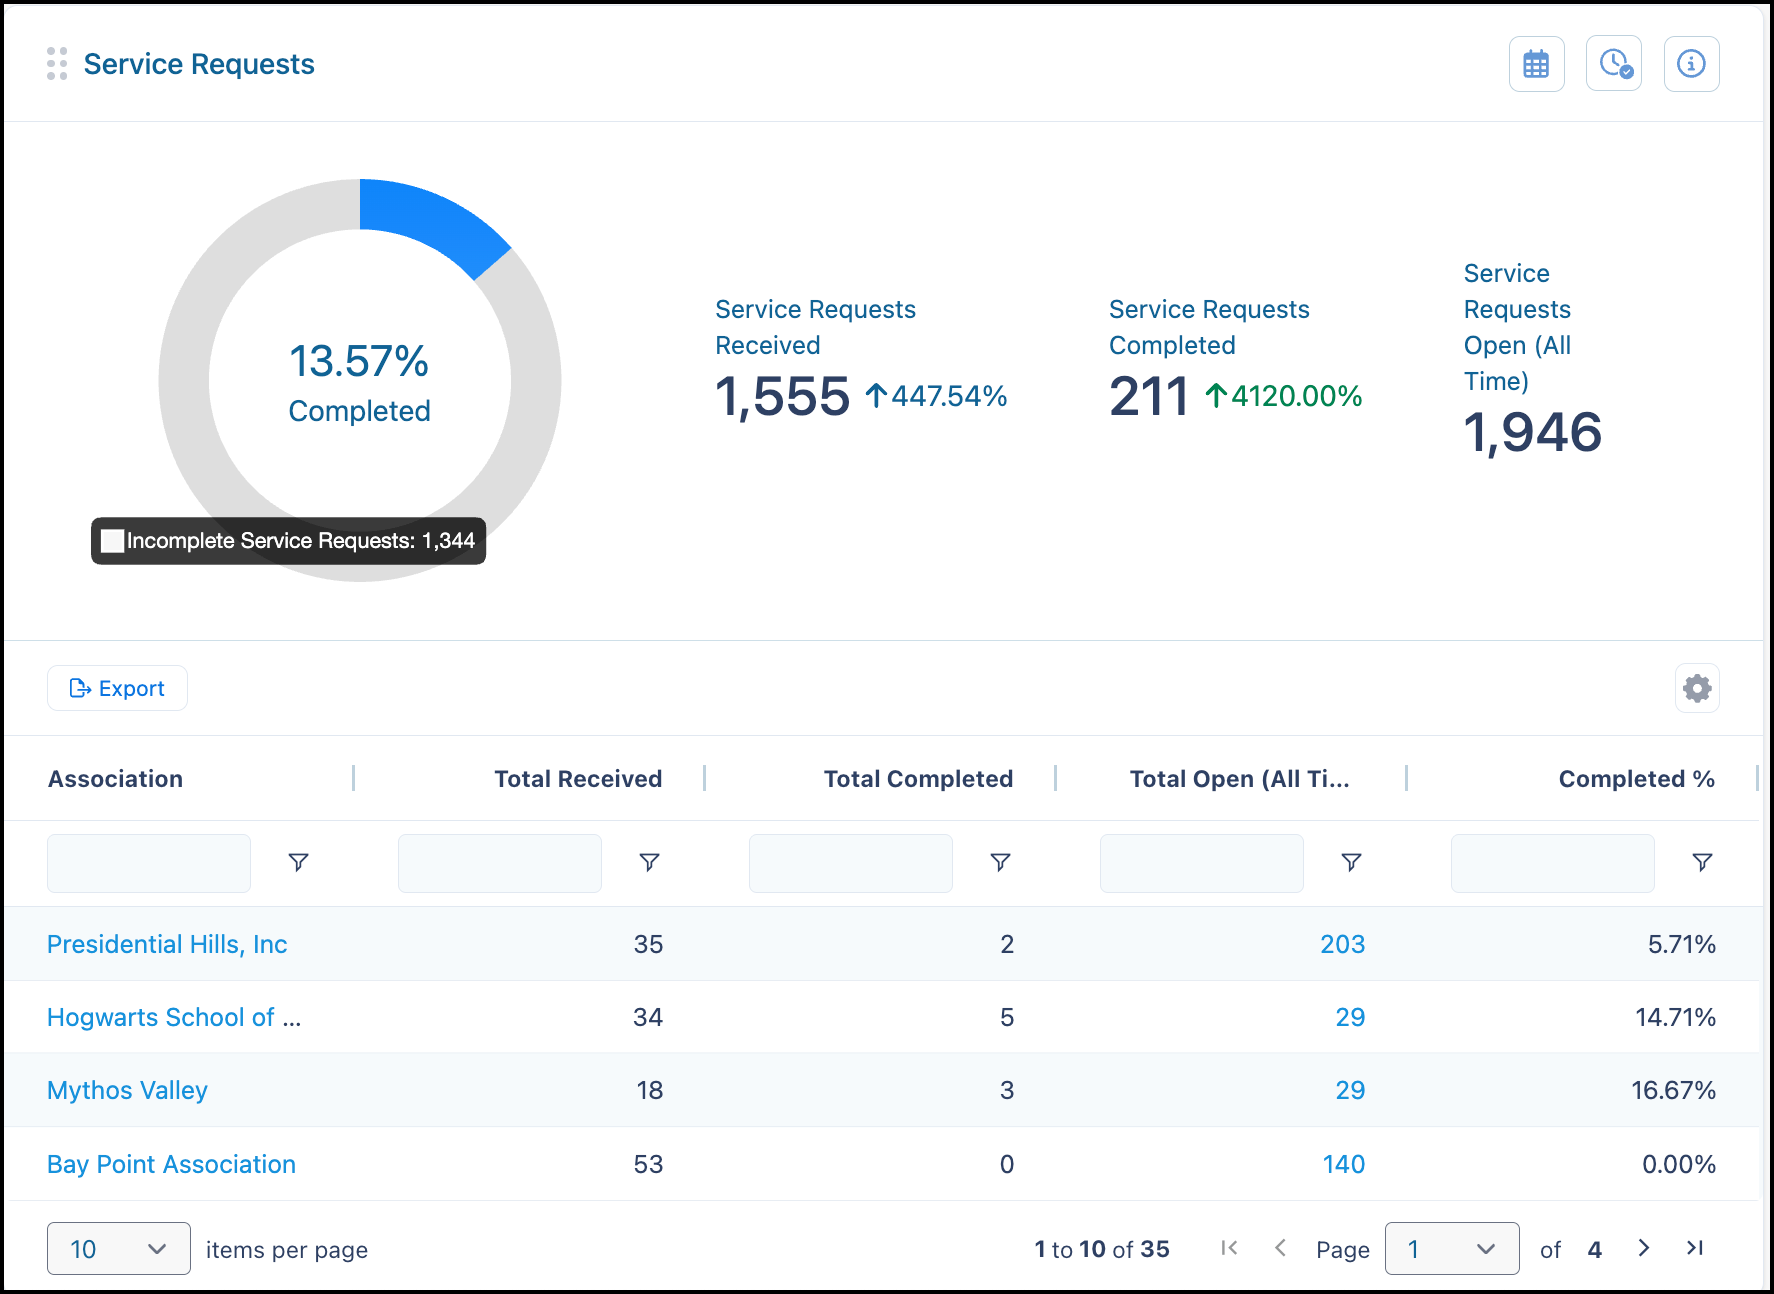
Graphs
Hover the cursor over any of the graphical information to show the legend key for your selection. For example, in the following graph, the legend key for the Incomplete Service Requests shows 1,344.
Settings
Vantaca IQ Admins will see a Settings navigation option that does not display for those without admin permissions. For more information about this option, see the Vantaca IQ Settings Page section of the "Vantaca IQ - Securities and Permissions" article.
Help
Click Help to open the Help page where you can navigate to the Vantaca IQ articles within the Vantaca Library.

Comments
0 comments
Please sign in to leave a comment.